
Submitted by lexa on
The histogram for an image and the overexposure warning are meant (in theory) for objective verification of the image while shooting and adjustment of shooting parameters according to the indications in the preview window one can see the overexposed areas right away, and the histogram displays the overall distribution of tones on the shot.
There are, unfortunately, a few problems that complicate the usage of these great tools:
- The scale of the histogram is unclear and is not documented by the camera manufacturers
- The histogram and overexposure warning are based on the JPEG-preview, thus the raw data undergoes certain transformations: white-balancing, tonal curve application, and also the color saturation is adjusted. These transformations depend on the camera settings for white balance, contrast, saturation, color space, sharpening, etc; thus for the same scene if the camera settings are changed the histogram is also displayed differently. At the same time, the raw data depends on the exposure and the selected ISO speed rating, while other camera settings have no impact on the raw data. In other words, for a raw shooter, the histogram does not accurately reflect the real data in the image file.
The impact of the white balance on the histogram can be turned off using UniWB (sorry, russian-language article translated by google, to be translated manually) but other settings cannot be turned off, only adjusted.
The goal of this article is to elaborate on the procedure of juxtaposing the camera histogram and the real raw data, as opposed to merely provide settings and numbers. This, among other reasons, was why the shooting conditions were not exactly typical.
We used a 5D Mark II camera with a 2.0.9 firmware and at 200 ISO. For other cameras, different shooting conditions, possibly other ISOs, and other firmware, separate measurements are to be performed.
Shooting conditions and exposure meter calibration
We were shooting on a spring day in a room with the windows facing west. The lighting source was the very bright and very clear blue sky, the lighting color temperature (measured with a Minolta ColorMeter IIIF) was between 8800K and 9900K. The temperature was remeasured after every batch of photos was taken.
For such unusual conditions, the exposure meter has to be calibrated in order to determine the headroom in highlights for a given camera.
Take a grey (white) card, expose it twice - according to the exposure meter, and with a guaranteed overexposure (+5-6 stops, maybe more). In our experiment we got the following numbers (slightly rounded):
- Saturation point: 14737 (for the given ISO)
- Grey point in the green channel: 950
Therefore the headroom in highlights is 15.5 times, or slightly less than 4 stops. For normal daylight shooting conditions the headroom in highlights for the given camera is about 3.7 stops, therefore calibrating the exposure meter was not an unnecessary step.
The auto white balance for the camera won t adjust that much, but if you manually set the white balance for 9900K (corresponding to the real lighting spectrum) this will provide for balanced peaks of the histogram.

Picture 1.
Let s take a note: the halftones ( grey according to the exposure meter )
- Two ticks to the right of the left edge.
- Or three ticks to the left of the right edge.
It is clear that the lighting is far from ordinary, but that makes it more interesting. For standard conditions, the photographer can simply memorize ( open up half a stop from what is indicated by the camera ), but can you trust the camera controls in non-standard conditions that is an important question.
Test scenes
It is boring to shoot a scene with one peak, but it is hard to decipher a histogram of a complicated scene. So lets place a monotone object that is darker than the background of a color or neutral backdrop. The scene with a neutral background looks like this:
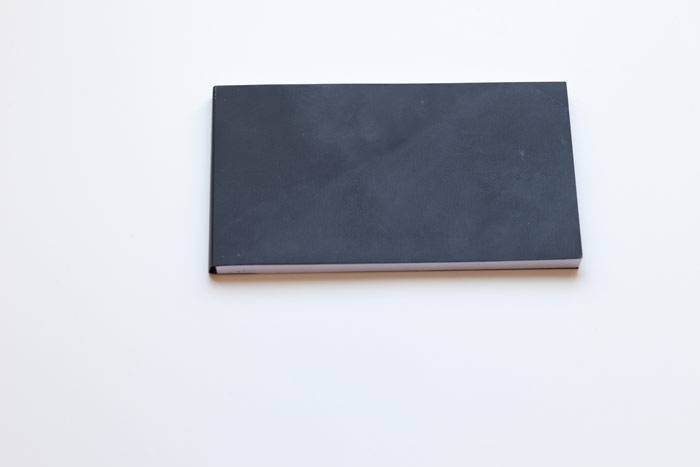
Picture 2.
According to the spotmeter, the brightness of the white background and the black cover differs by ~ 3.5 stops (1/6s and 1/60s f/8 ISO200)
For the color background a piece of red cloth was used, thus the scene looks like:
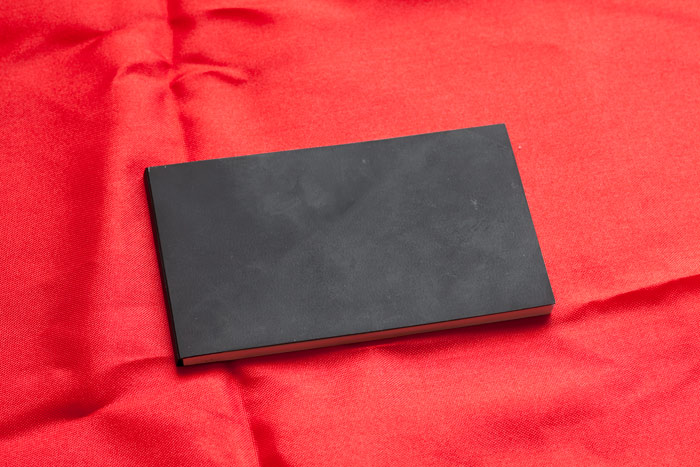
Picture 3.
Lets shoot these scenes
- Using different white balance settings (corresponding to the light, and also with UniWB setting)
- Using different contrast settings: Normal and increased/lowered (we will figure out which works best as we go)
- Using different exposure, so we can catch the moment when the camera will start showing the overexposed areas.
All in all, there are a lot of combinations, so in this article we will examine only the most interesting ones.
The shots with the red background were shot after the shots with the neutral one, and due to the time difference, the lighting changed (the color temperature dropped to 8800K, and the luminance changed), therefore we cannot compare the exposure in the two series.
Standard white balance setting
Histogram behavior
The histogram behavior is easier to examine on the neutral image.
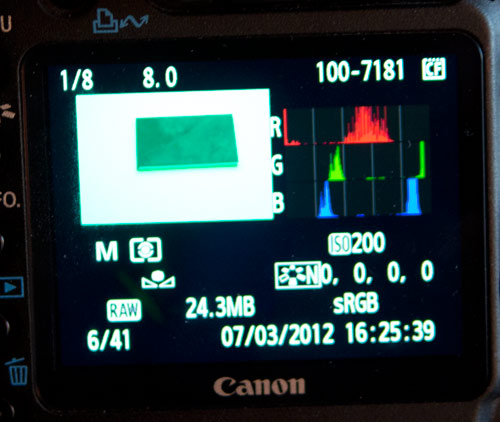
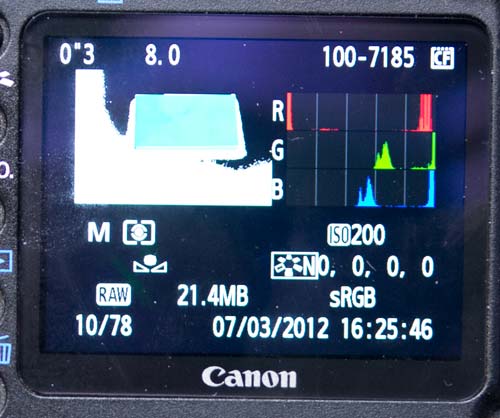
4 shots with exposure intervals of 1 stop (the exposure data is seen on the images):
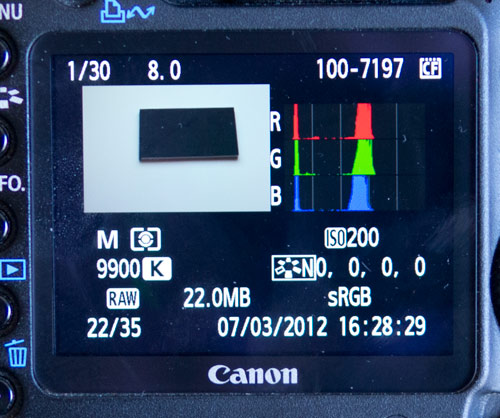
Picture 4.
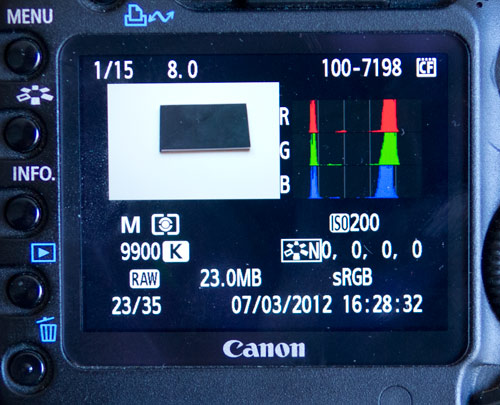
Picture 5.
Picture 6.
Picture 7.
(on the last shot - Picture 7. - the white fell into the overexposed range, so we will examine that a bit further).
As we can see, for a 1 stop shift of the exposure, the right peaks of the histogram shift approximately (but quite faithfully) by one tick along the histogram.
It is important to note that the left peaks shift less. After a 3 stop shift (1/30 to ) the peaks shifted less than two ticks along the histogram - .5 points for the first stop shift (1/30 to 1/15) and slightly less than a full tick for the next stop shift.
We can see that with the given settings, the horizontal scale of the histogram is non-linear. A 3-stop exposure shift corresponds to
- 3 ticks on the histogram in highlights (to the right)
- About 2 ticks on the histogram in shadows (to the left)
The total width of the histogram is about 6 stops.
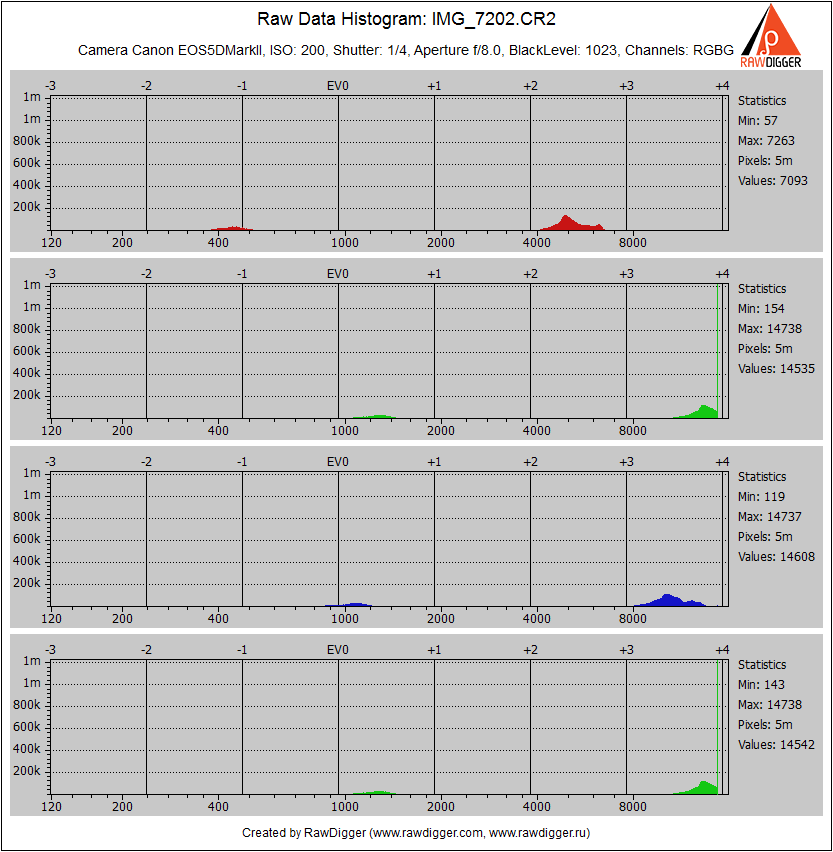
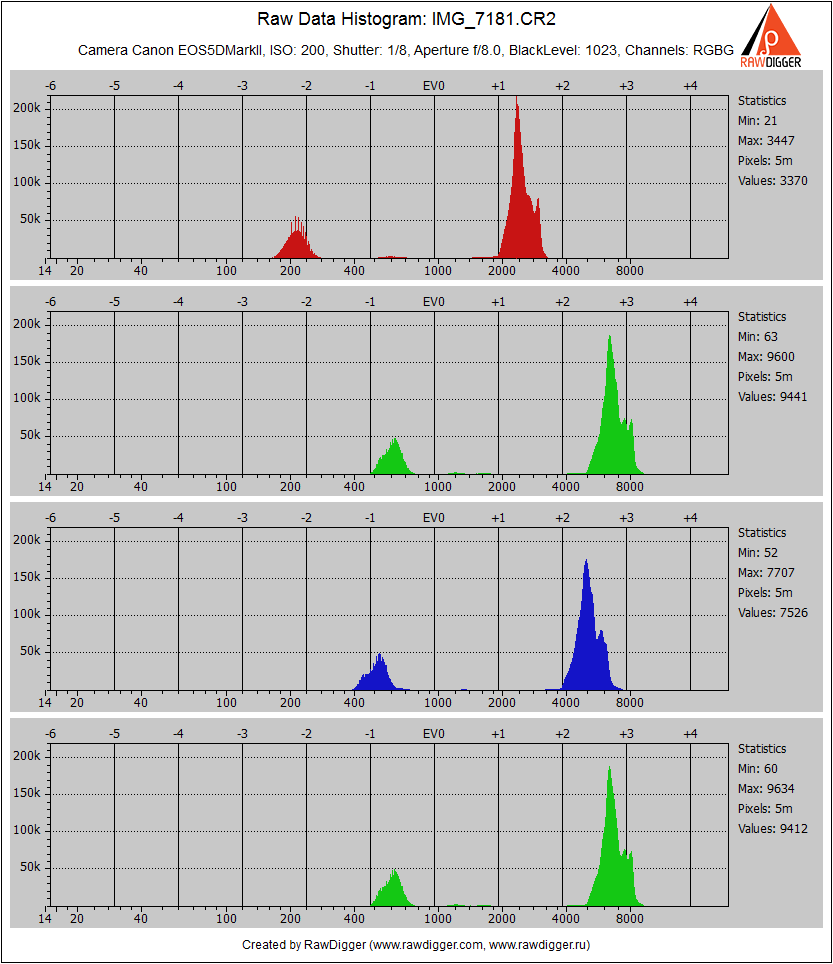
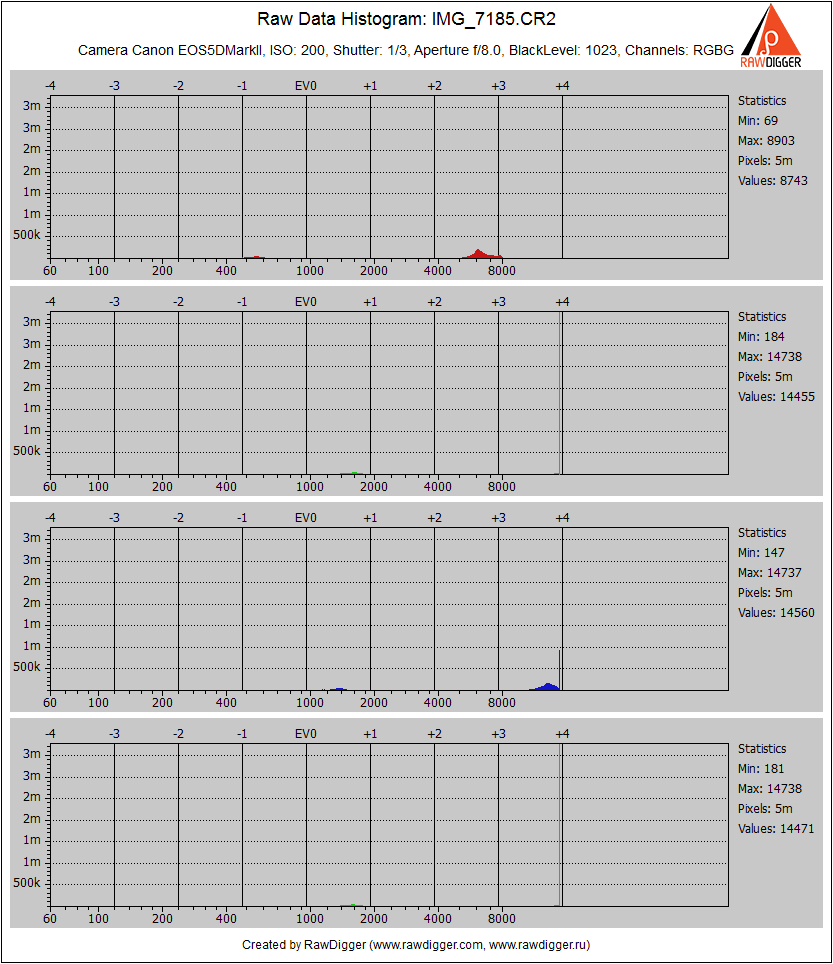
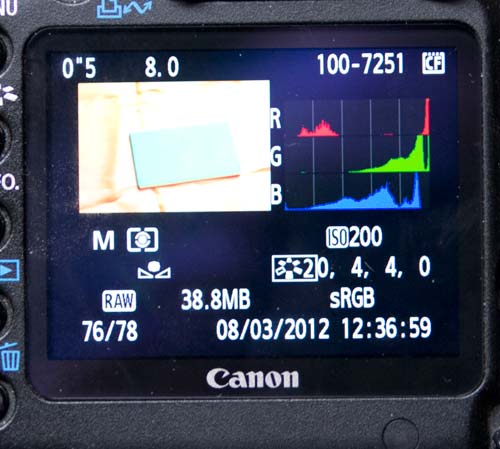
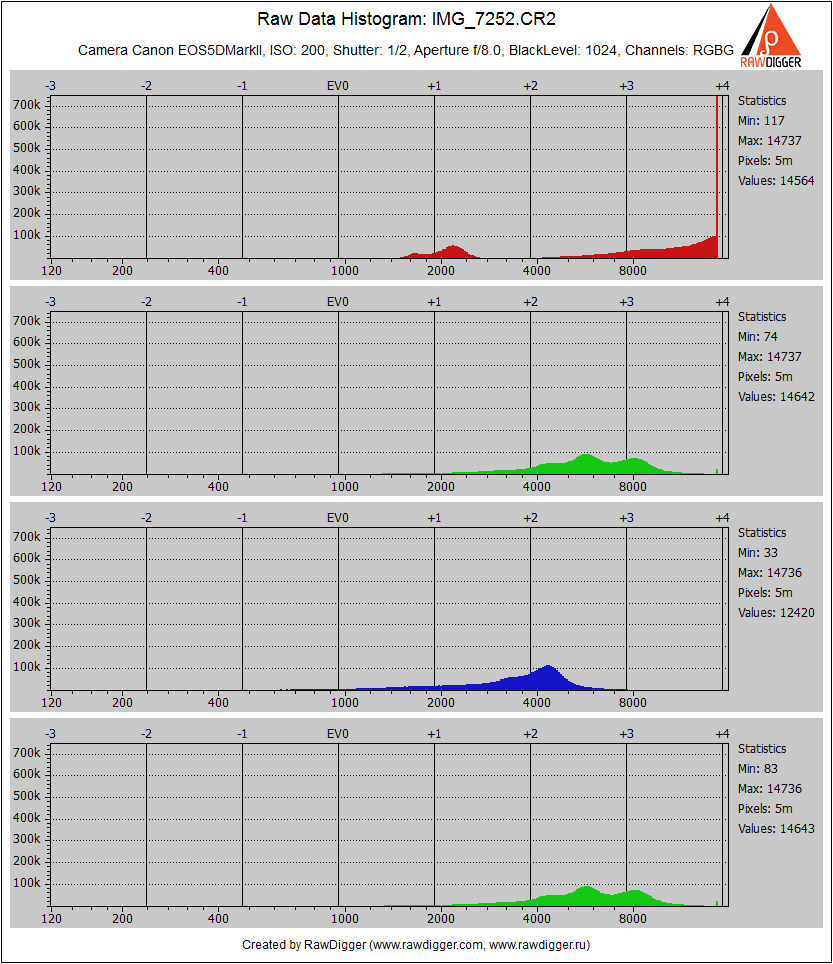
The real raw data histogram looks slightly different. Here is a histogram for the exposure of 1/15 (the second shot from the above-shown series - Picture 5.).
Picture 8.
We can see that:
The camera histogram spikes and overflows upward, with the right peak going towards infinity, as we cannot see its actual height. We can also not see the step on the right peak.
- The channel imbalance is not visible (which is not surprising, since the white balance was selected so it would neutralize the main background)
Playing with the display parameters of the in-camera histogram, we can approximately understand how it is set up:
- The vertical axis scaling is linear
- The total height of a histogram field is several tens of thousands of pixels (it is impossible to determine a more exact number, due to the varying horizontal scaling), and everything that is above that range is simply truncated and not displayed.
Overexposure indication on a monochrome shot
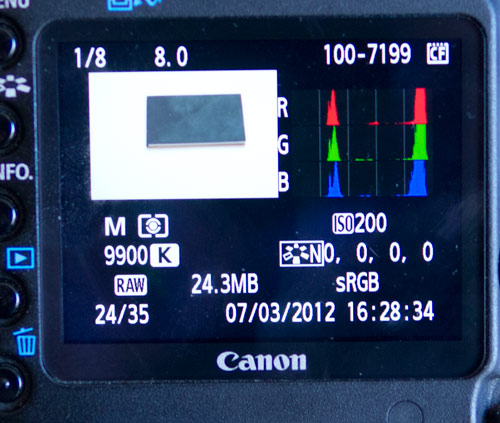
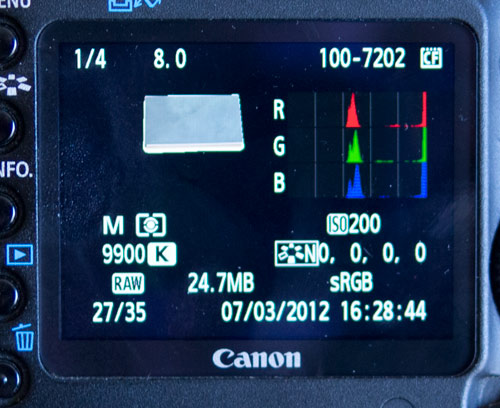
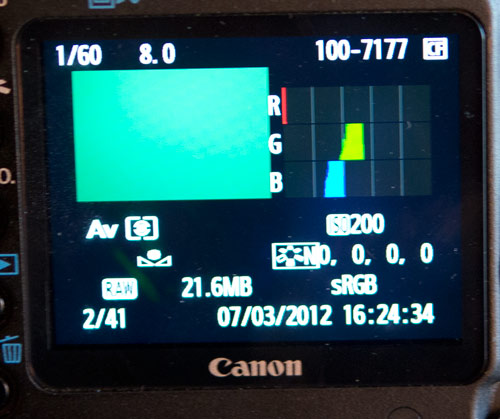
To study overexposure, we selected exposures from 1/8 (the camera does not show overexposure) to 1/4s (the camera shows that the highlights have been blown out, on the white background), with the minimum possible exposure step of 1/3 EV.
- 1/8 s
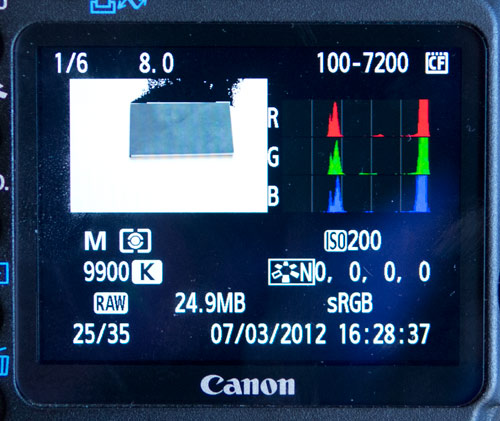
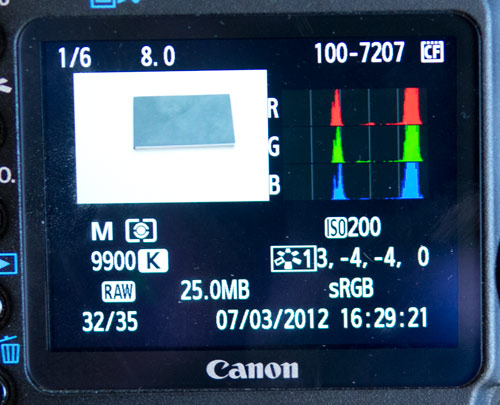
Camera does not show overexpose (the 3rd shot in the series above) - 1/6 s
The camera shows a small overexposed area in the top area of the shot (the blackened area)
Picture 9.
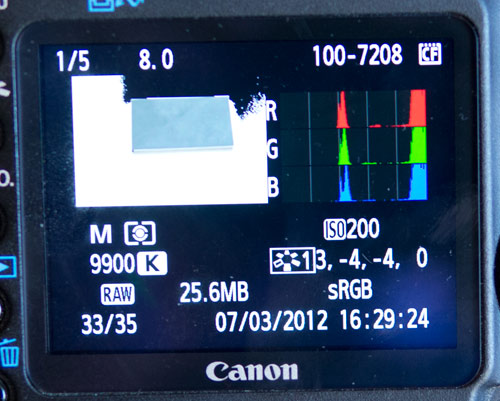
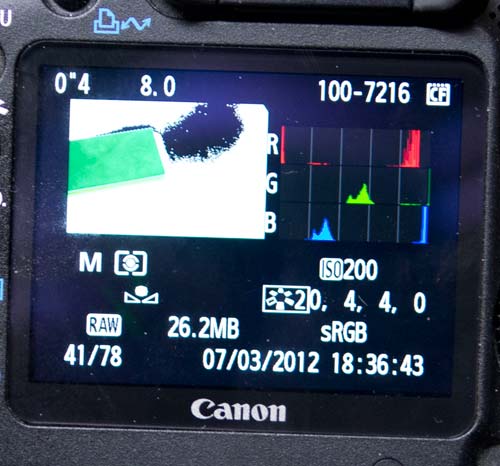
- 1/5 s
The camera shows a large area of overexposure:
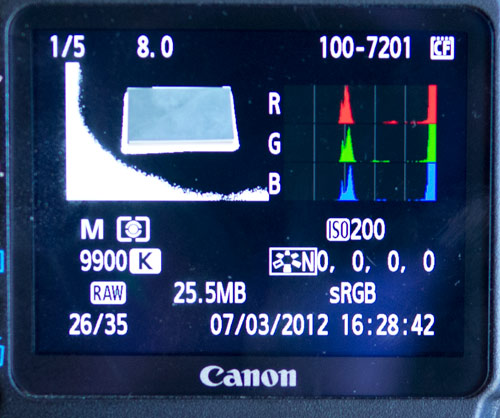
Picture 10.
- 1/4 s
All the whites are blown out (the last shot in the series above)
What about the raw data histogram?
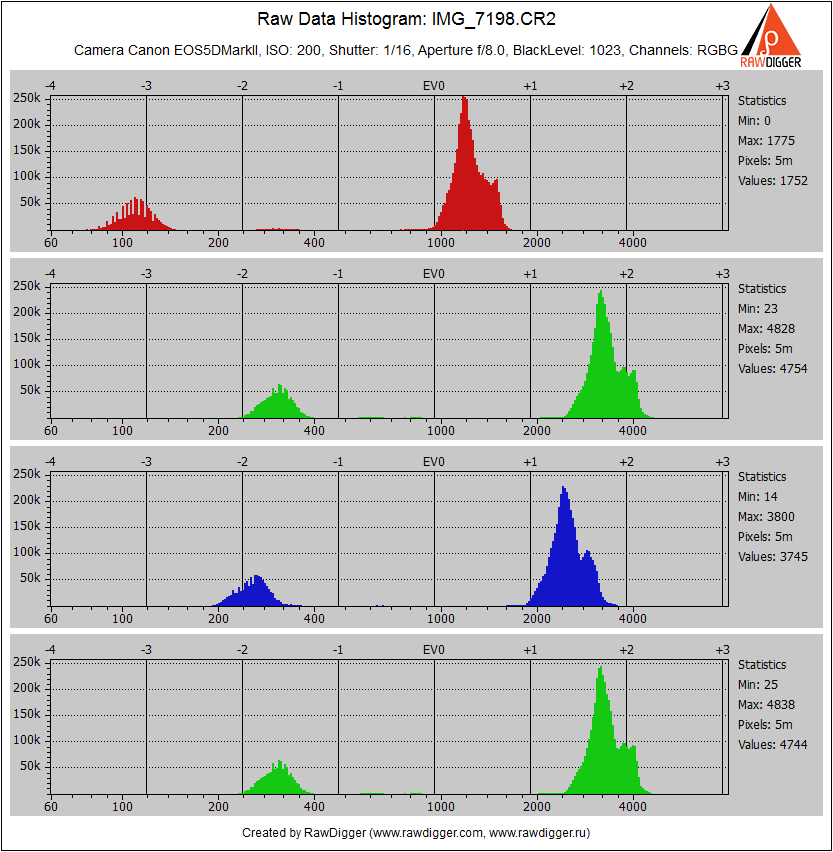
- We won t even look at the 1/8s: we can tell from the 1/16 histogram that the headroom in highlights is more than a stop (the maximum value in the green channel is 4800, saturation point is 14737), it is obvious there is no overexposure.
- 1/6 s
Saturation is not reached; the maximum value in the green channel is 12661, and even less in all other channels. We are close to the maximum (14737), but there is still a headroom:
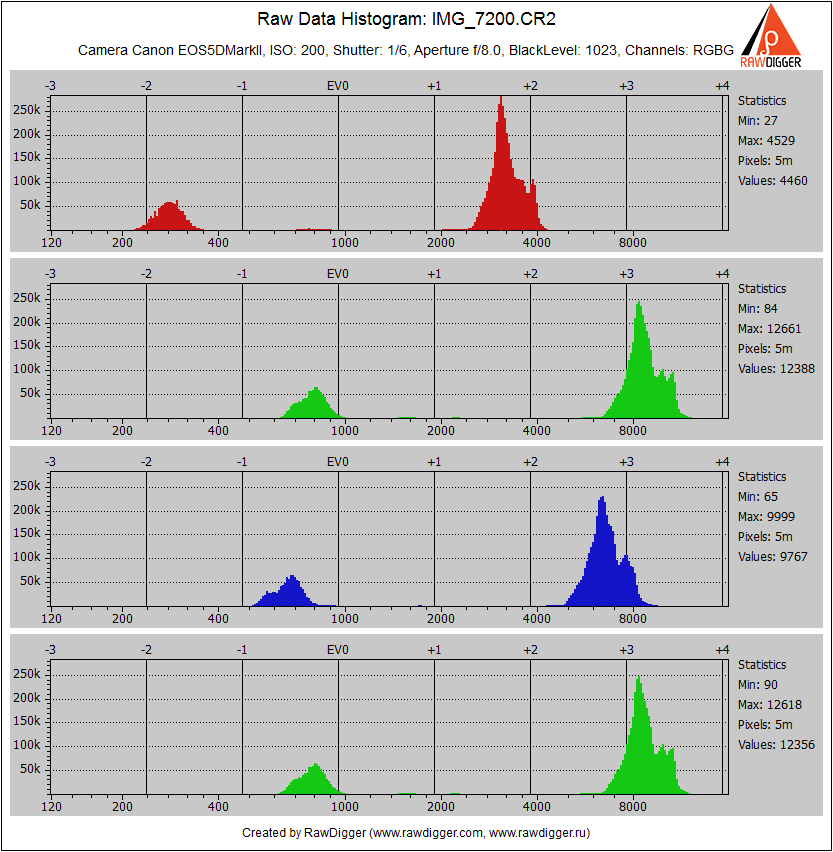
Picture 11.
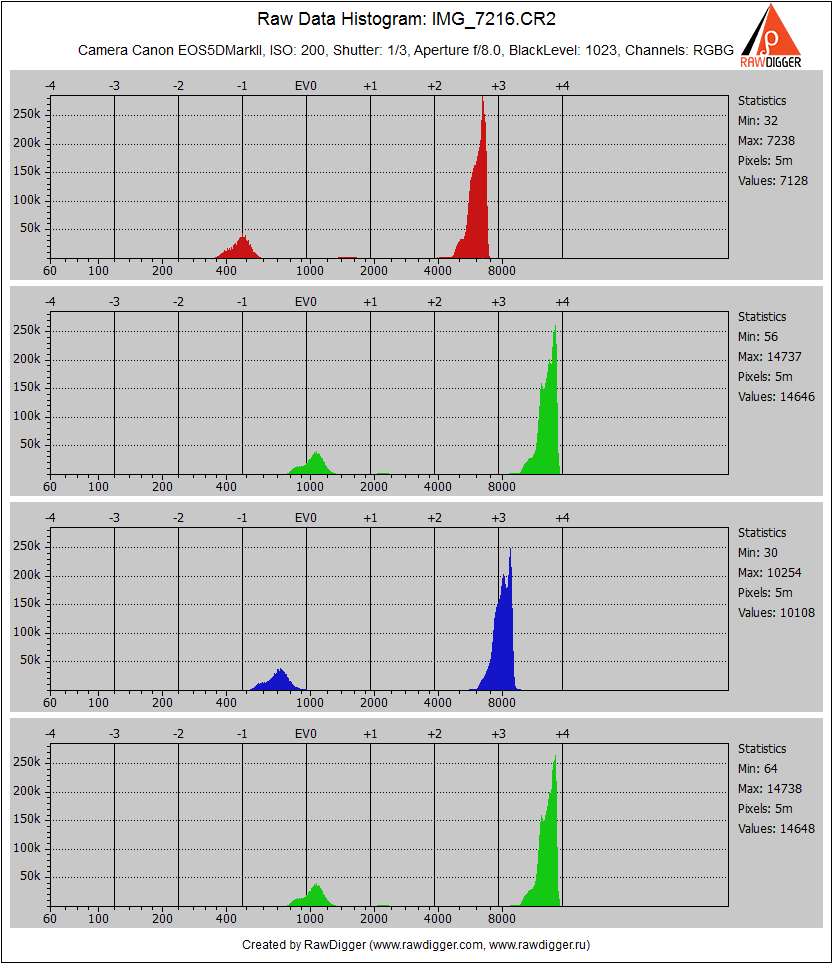
- 1/5 s
The saturation is reached, the maximum value in the green channel is 14736/14737, but the histogram is not touching the right edge, so there are not a lot of saturated pixels
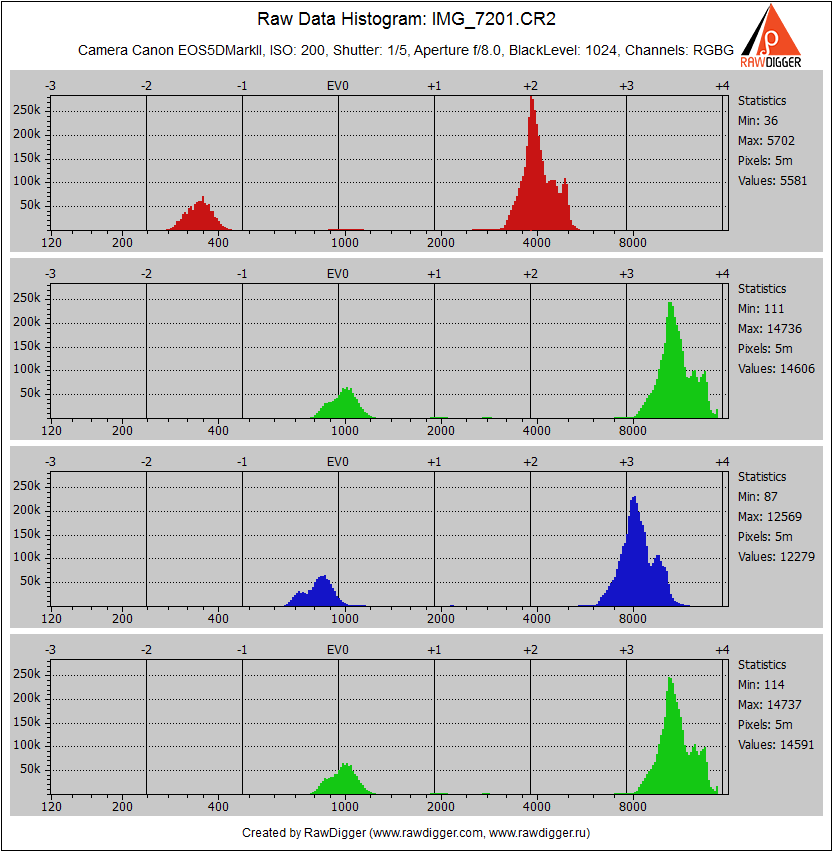
Picture 12.
Below is a zoomed region of a histogram displaying the highlights from +3 to +4 EV. On the right edge of the histogram there is a peak, but it has about 15 thousand pixels (out of 5 million pixels in each of the channels), which is very few. If for shooting ETTR, this would be the ideal exposure.
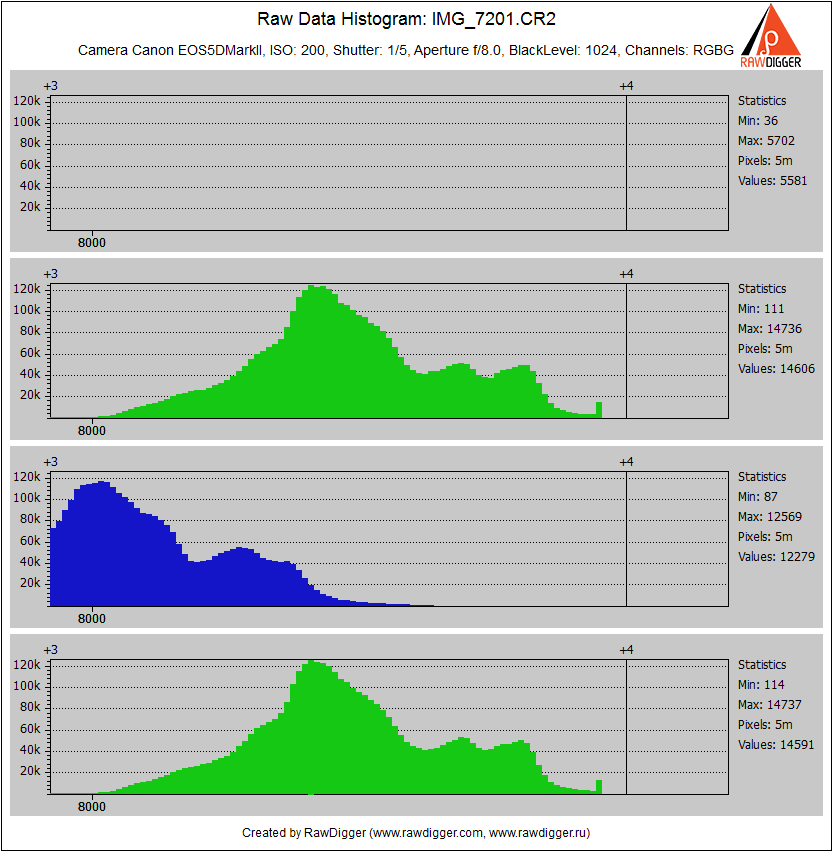
Picture 13.
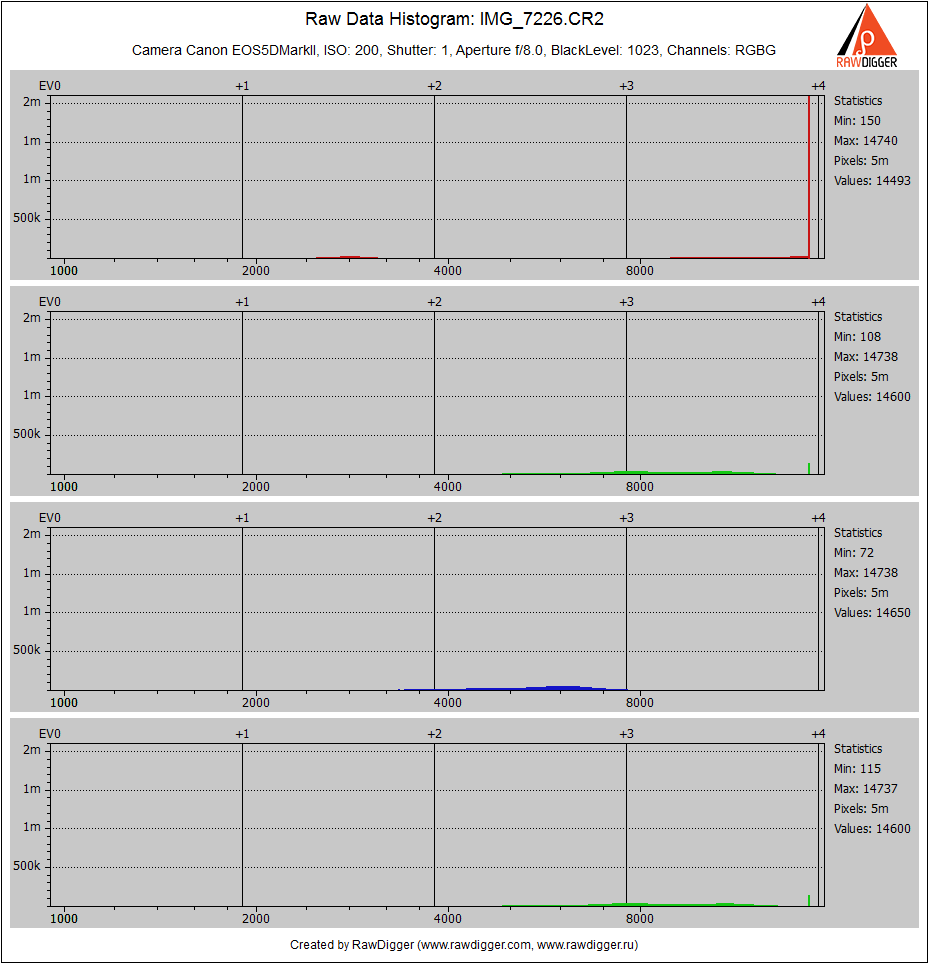
- 1/4 s
A clear overexposure in the green channel, while the other channels are exposed without being blown out. The highlights on this shot can be brought back using Highlight Recovery (given the neutrality of the highlights):
Picture 14.
Therefore, for the standard contrast and saturation settings (Neutral setting) the overexposure indication is approximately .5 stops more conservative than it should be the indication turns on at 1/6, and an actual overexposure can be observed at 1/4 s.
Lowered contrast
Setting the camera to a minimum contrast and saturation mode, let s observe the overexposure indication again
- 1/6 s
no indication, the histogram is not touching the right edge
Picture 15.
- 1/5 s
there is an indication on a larger area than the actual number of overexposed pixels (as mentioned above, at this exposure, 15 thousand pixels are overexposed, which equates to .3% of the image area), but the indication covers the area that is smaller than that with a standard contrast setting
Picture 16.
Therefore, with a lowered contrast setting, the camera continues to indicate overexposure even when it s not present, but the overstated indication is closer to reality and more acceptable, since the difference between real raw blow-out and in-camera warning is now less than 1/3 stops.
Color background
The scene with the color background is interesting because the peaks in the green and blue channels for the background and for the black subject are almost identical.
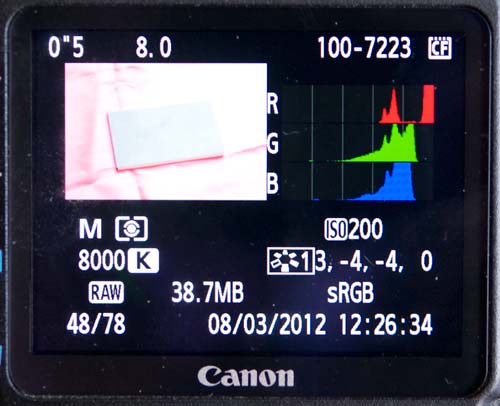
Here is the camera histogram for exposing according to the exposure meter and low contrast setting.
Picture 17.
And here is the raw data histogram:
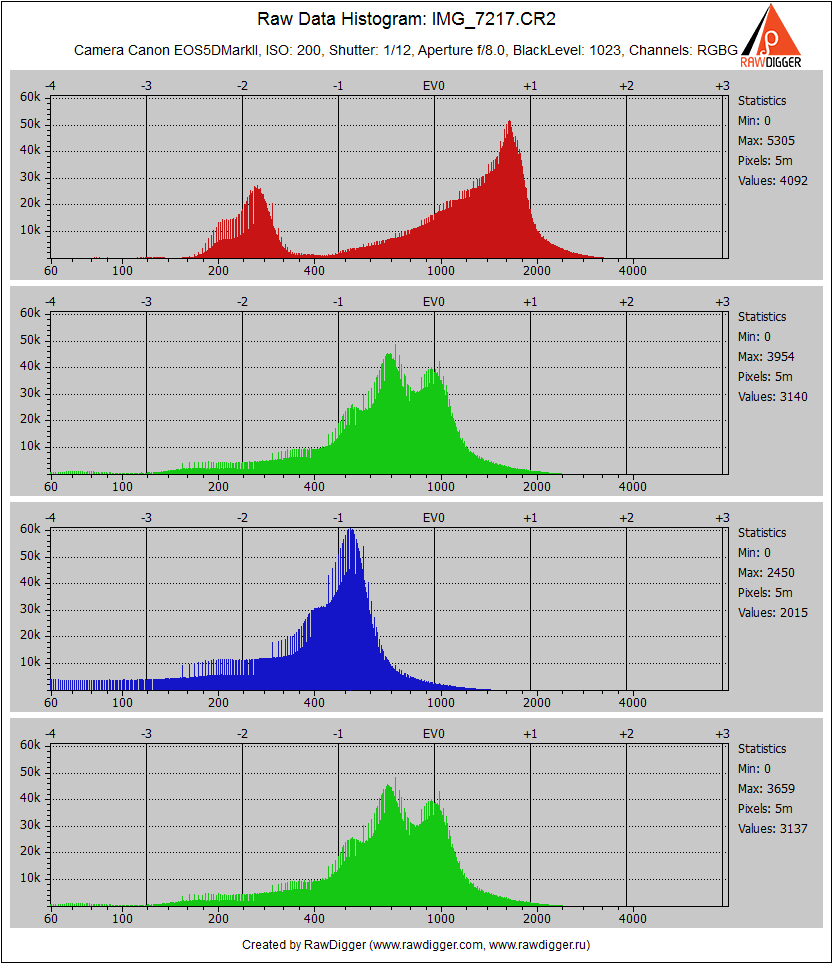
Picture 18.
The histograms show some family resemblance, but that s it. The red channel camera histogram does not indicate that there is an additional 1.5 stop headroom. If you eyeball it, it doesn't appear to be more than half a stop.
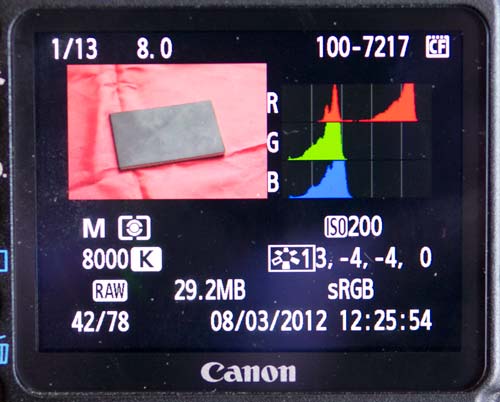
Overexposure indication
Let s see where the overexposure is indicated and where it actually happens. Lets start with a lowered contrast setting, which worked well with the previous shot, where the bright background was neutral.
A noticeable (but not fatal) overexposure starts at 1/2s f/8.
Neither the camera nor the histograms indicate the overexposure.
Picture 19.
If you look at the raw data, the overexposure has started (60k pixels in the red channel are saturated):
Picture 20.
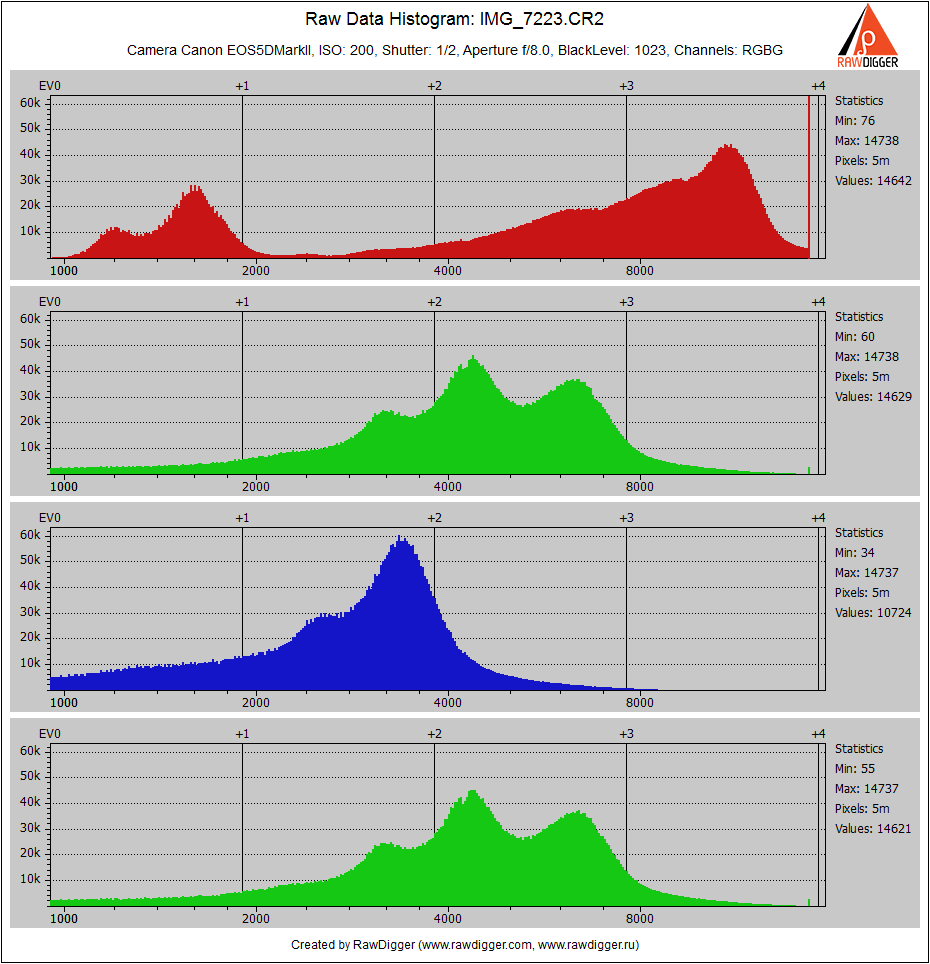
Some degree of camera indication of oversaturation starts at 1.0s-f/8 (small black dots on the image):
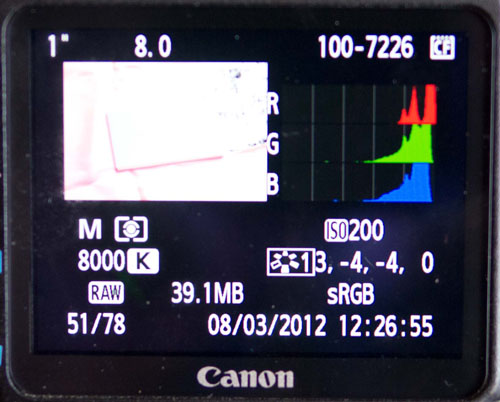
Picture 21.
The raw histogram shows that the image is blown out in the red channel, and judging by the amount of pixels reaching maximum values (more than 2 million), this is happening in all of the red background.
Picture 22.
Therefore, with the low contrast setting, which worked well with the neutral background, the camera delays the overexposure indication by about 1 stop.
Normal contrast
With a normal contrast setting (profile Neutral w/o modifications), the overexposure indication in the red channel starts at 0.6s-f/8, which is 0.3 stops after the overexposure actually happens.
UniWB
Grey map histogram
The histogram of a grey map exposed according to the exposure meter, makes you wonder. The range between the red and green channels is too great, and with a normal white balance, such a range corresponds to at least three stops.
Picture 23.
The raw histogram is completely predictable, with a 1.5 stop range between the green and red channels.

Picture 24.
A shot with two targets
On the shot with two targets the red peak for the dark target moved all the way to the left, the red peak for the light background has various unexplainable peaks (maybe these are the byproducts of rounding-off in the camera s integer arithmetic):
Picture 25.
The raw data histogram is quite different. The distance between the right green peak and the left red peak is about 4.5 stops, which means that the range of the camera histogram given a UniWB and the given contrast settings is not 6 stops, as in the previous measurement series, but no greater than 4.5 (probably even less).
Picture 26.
Oversaturation indication
With normal contrast settings, the oversaturation indication starts at 1/3s f/8. According to the raw data, the shot is very overexposed.
Camera display:
Picture 27.
Raw histogram of the same image:
Picture 28.
If you set the contrast and saturation to the maximum values, then everything is much better, and the indication is practically perfect.
The camera starts showing an overexposure at 0.4s-f/8:
Picture 29.
The raw histogram also shows the very start of an overexposure (the green channel has a few maximum-value pixels):
Picture 30.
Maybe, the camera contrast setting can be lowered slightly, as the camera is being too wary.
UniWB+color background
We decided to not torture the reader with an overabundance of pictures, so we will show two pairs, both with the camera contrast at the max.
1/2s f/8 the camera doesn't indicate anything, and the raw data shows a minimal overexposure, which can be neglected.
Camera:
Picture 31.
Raw data:

Picture 32.
0.6s f/8 the camera histogram shows areas of spot overexposure (camera image is zoomed to show detail):

Picture 33.
The same is visible on the raw data histogram:
Picture 34.
Therefore, the max contrast setting, along with UniWB, allow us to sufficiently accurately control the overexposure using the built-in camera tools. There are small errors, but they are within 0.3EV.
Conclusion
In standard (i.e. corresponding to the shooting conditions) white balance settings, the camera histogram and the camera overexposure indicator cannot be used to control overexposure.
- For images with neutral bright areas, the acceptable accuracy of overexposure warning is reached at the minimum contrast setting
- For colored highlights, on the contrary, the contrast has to be increased to the standard settings.
- The histogram height cut-off (at the 30-50 thousand pixel level) makes it impossible to estimate the highlights based on how much the histogram is squeezed to the right, since overexposed shots and normally exposed shots look practically the same in highlights.
At the same time the tonal range of the histogram in this mode is pretty large, about 6 EV, which allows to evaluate the image as a whole. It seems (comparing to the histogram in UniWB mode ) the tonal range will change depending on the white balance, which complicates using the histogram as an accurate instrument.
When using UniWB, the value of the histogram is decreased, since the tonal range is decreased, and there are unexplained artifacts.
Nevertheless, the UniWB mode, combined with a max contrast setting allows us to sufficiently accurately (within 0.3 EV) control the overexposed areas of an image. The same setting works for both neutral and colored highlights.
The Unique Essential Workflow Tool
for Every RAW Shooter
FastRawViewer is a must have; it's all you need for extremely fast and reliable culling, direct presentation, as well as for speeding up of the conversion stage of any amounts of any RAW images of every format.

Now with Grid Mode View, Select/Deselect and Multiple Files operations, Screen Sharpening, Highlight Inspection and more.
Add new comment