
Submitted by lexa on
This article is the first of a series, dedicated to explaining what is the histogram of raw data, what are the various ways of exploring it in RawDigger, how it can help to better understand how your camera functions, and how it can aid in improving your shooting through better understanding of raw data. In this one, we are going show you how to navigate the RawDigger histogram.
Before we get to any of this, however, let’s define what exactly IS a histogram of raw data?
Note: If you know what a histogram is, and know the difference between the histogram on the back of the camera and the histogram of the raw data, feel free to skip to the next part. But maybe even if you think you know all about the histograms the below is worth reading.
Say we took a shot with a digital camera. Opening the shot in a raw converter we will see something like this:
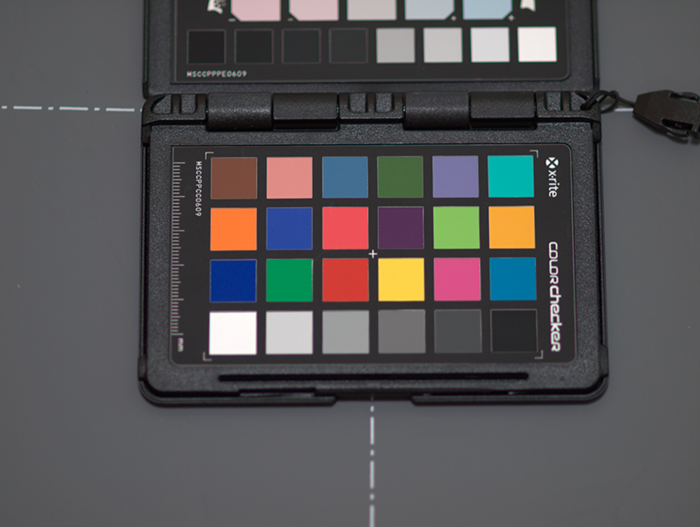
Figure 1.
It is a rendition of the raw data, not the raw data itself. When we shoot in RAW, then, if we use the common meaning of “picture” (as in something that can be directly viewed), there is none. What there is a set of RAW values, which are measurements of light, as if the sensor is composed of many light meters – one at each pixel location. Each value in the set is nearly (less noise, flare, and effects at deep shadows and extreme highlights) directly proportional to the value of the light intensity, measured by the corresponding pixels of the camera sensor during exposure.
As with any measurement device, light measurements here are also only within the certain range (the ranges can be switched, that is where the ISO setting often comes to play). Suppose that the camera we used is a 12-bit one. For a 12-bit camera (when we say 12-bit we mean the camera has a 12-bit analog-to-digital converter, ADC) RAW data for every pixel can assume values ranging from 0 (the pixel was not affected by light in any way or the effect was below the lower limit of the range) to 212 -1 = 4095 (the RAW data for the pixel has been clipped, or the pixel being saturated - that is, the pixel charge is above the upper limit of the range). In real life a 12-bit camera may not reach 4095 maximum even for a grossly overexposed shot; also, some cameras we consider to be 12-bit may have maximum values slightly larger than 4095. Those are by design, depending on particular hardware and firmware implementations. Even for the same sensor various camera makes and models can have different maximum values.
Note: maximum value may depend on ISO setting. It is worth to determine maximum values for your camera for each ISO setting, including "intermediate" settings, that will help you with understanding how your camera light meter is calibrated, where the camera places the midtone, and how much headroom you have above the midtone.
Let’s plot a histogram for the raw data of the image above. How do we proceed? We read the raw data and calculate how many pixels took the value of 0, 1, 2, etc. up to our max of 4095. For each value (0..4095) we will be plotting a bar with the height equal to the number of pixels that assumed this given value. When finished, we will get no more than 4096 bars.
Note: There can be less than 4096 bars since it’s possible that some values from a given range got no pixels, like it is in the case of underexposure or raw data which was pre-processed in some way, right in the camera, before recording the raw file. Some common examples of such in-camera raw preprocessing include color channel preconditioning, lossy compression, and digital ISO which simply statches the histogram leaving voids.
This is going to be our histogram with a step (bin size) of 1, because we used each value from our range of 0 to 4095. The horizontal axis of the histogram reflects the range of all the possible values for that camera. The vertical axis represents the number of pixels that got that value.
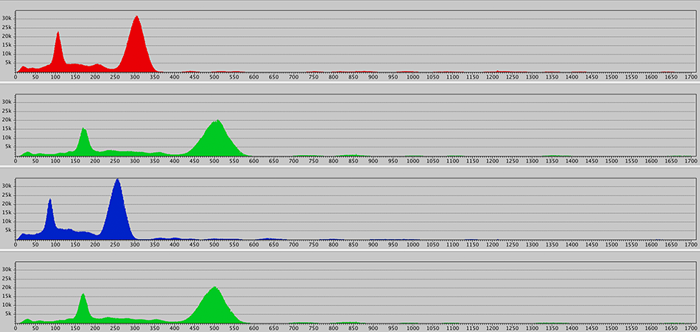
Figure 2.
We have two problems with this bin size. First of all, the entire graph does not fit to a monitor screen, and second of all, even if it fits, it’s untrustworthy. Since the camera’s sensor is not an ideal measuring tool, but is in fact a real world object, the values we get from its pixels are subject to all sorts of fluctuations (due to innate defects, slight differences between the pixels, photon noise, read noise, thermal noise, etc.). This means that a pixel can take on not an exact value it should, but a value within a certain sub-range. In this case, it makes more sense to count the amount of pixels that took the value from this sub-range as a way of averaging them out.
This way, we are making a bar not for each value, but for each sub-range. The width of the bar is equal to the width of the sub-range, and the height of it is equal to the number of pixels that assumed values from that sub-range.
The width of the sub-range - bin size - is chosen based on the particular problem we are trying to solve. A good start for a 12-bit camera is a bin size of 4, while for a 14-bit it’s 16. Thus we both reduce the length of the structure, and raise the trustworthiness of our values, since we’re really rounding, which reduces the influence of noise and improves the perception of the shape of the data distribution.
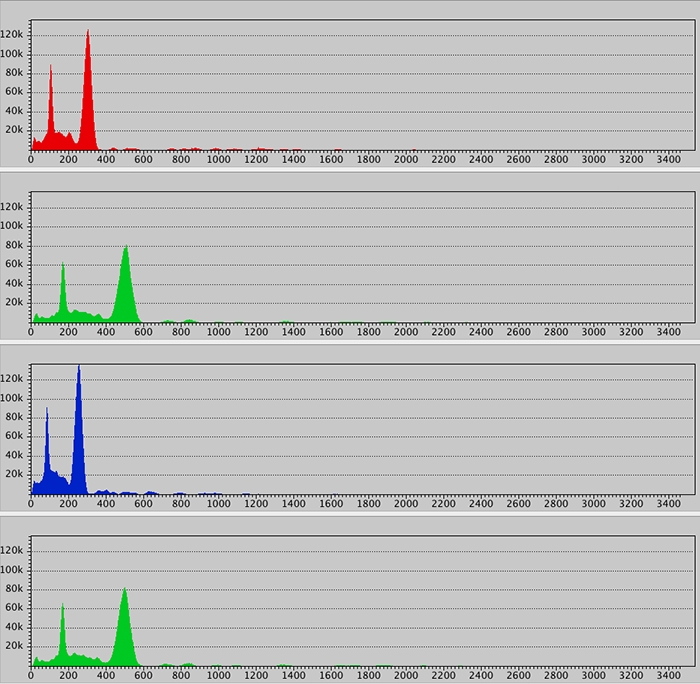
Figure 3.
However, while analyzing the specifics of the RAW format, the maximum and minimum values in the sensor’s color channels, the behavior of the sensor close to the maximum and minimum, as well as during the analysis of noise, digital ISO, various forms of preconditioning and compression, the bin size is usually equal to 1 and we select only a part of the full-range histogram to be presented on the screen. For example, on the histogram below (with bin size = 1) one can see raw data irregularities close to sensor saturation.
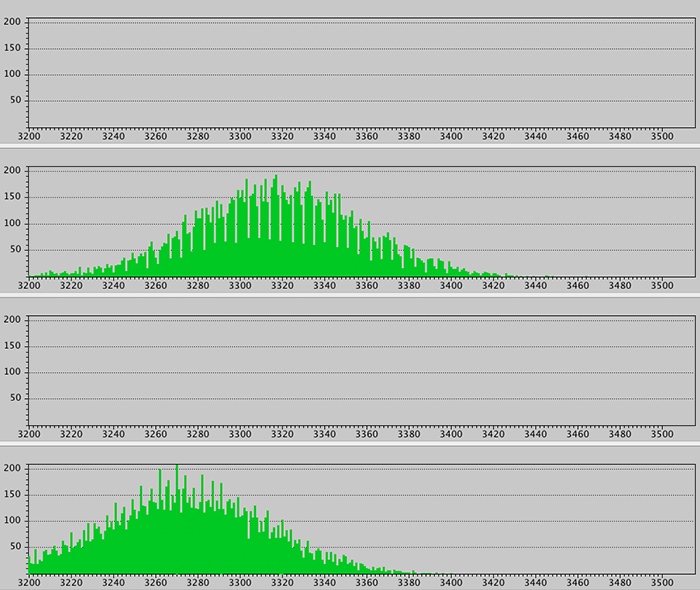
Figure 4: Raw data irregularities close to sensor saturation
On a side note, there is some Internet opinion that “a good shot must have a correct histogram”. So is there such a thing as a “correct histogram”? The answer is no, or at the very least – not universally. Photography is an art, with both technical and artistic components. However from the technical standpoint there are some guidelines that can be useful when analyzing the histograms for “correctness”.
For the majority of scenes we consider a histogram to be technically good if:
- A wide range of values is included, and each of these values occurs a reasonably large number of times (meaning that the histogram reflects the real image data, not scattered highlight noise with values occurring only several times, see example below)
- There aren’t any wide gaps in the histogram, meaning pixels within a particular sub-range of values do not occur at all, or occur only 1-2 times, especially in the highlights zone.
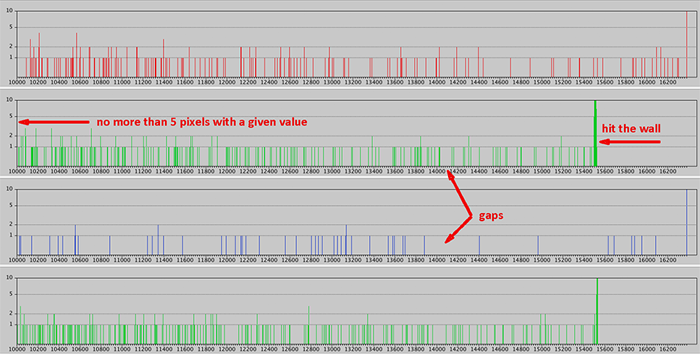
Figure 5.
- The histogram starts (at shadows, left part) and ends (in highlights, right part) with a smooth shape – there is no “hitting the wall” in the minimum or maximum values (an acceptable example of approaching highlights and shadows for X axis in linear mode, Y axis in log mode is like on the histogram below; we will be discussing histogram display modes in detail a little later in this paper).
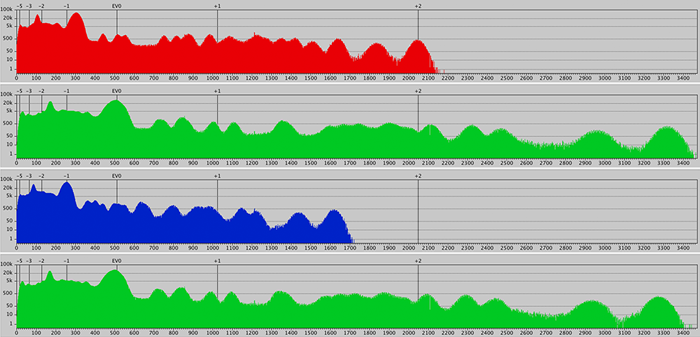
Figure 6.
If these criteria are met, we say that the exposure is set correctly and there are no technical flaws in the image.
However, from an artistic point of view, it is not necessary to create a shot enforcing all of the above criteria. Moreover, the shooting conditions can get in the way of “achieving the correct histogram”.
Ultimately, the end goal of photography isn’t a histogram, it’s the photograph.
Difference between a histogram in RawDigger and histograms generated by cameras, raw converters, and Adobe Photoshop
Let's have a look at the histogram in Photoshop:
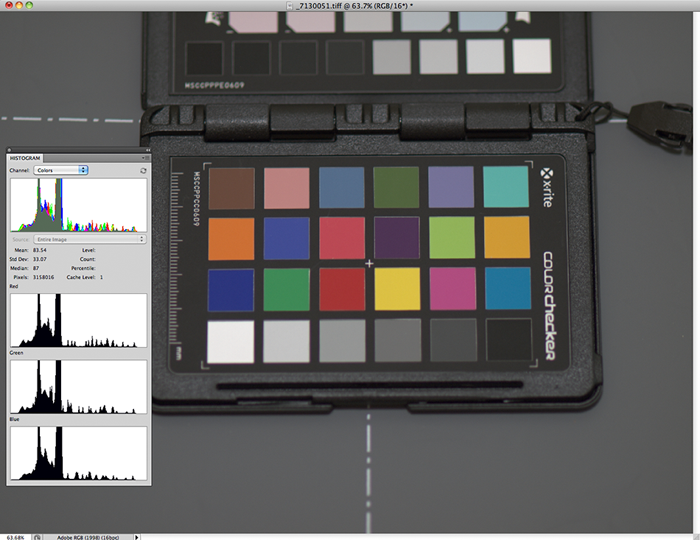
Figure 7.
You can see Photoshop histogram “clips on Y”, 2 peaks on the histogram hit the ceiling. This is because the Photoshop histograms are not always conveniently scaled to show the outline. The benefit is – one can see the bars for smaller amounts of pixels assuming certain values. The drawback is probably that it is impossible to evaluate the shape of the histogram.
Now let’s compare it to the RawDigger raw histogram for the same shot, using both linear…
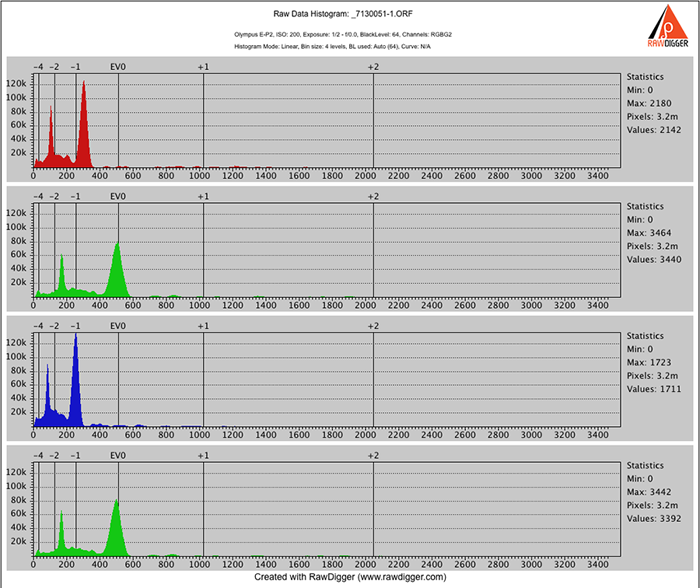
Figure 8.
… and log Y scales for bar heights:
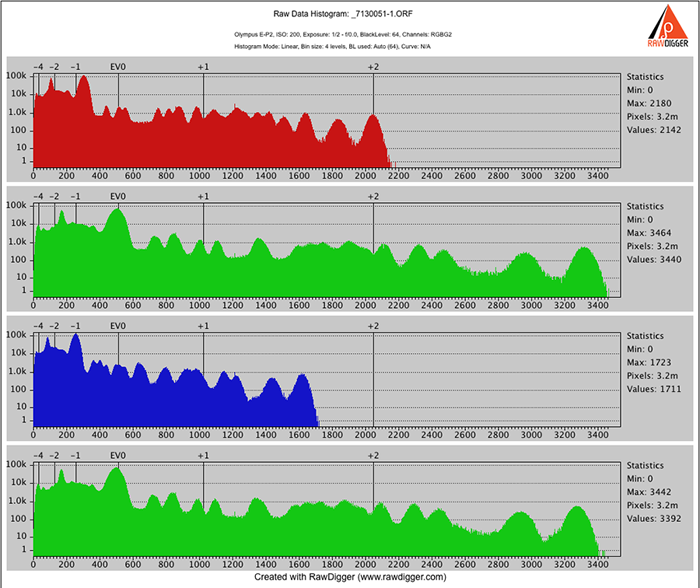
Figure 9.
As you can see log scale for the vertical axis helps to see the bars which represent relatively small amounts of pixels that would be invisible in linear scale.
Unlike the in-camera histogram (which is based on the in-camera JPEG, meaning that it depends on the JPEG settings and not just on the RAW data), or the histogram in a raw converter, RawDigger shows the histogram for the actual RAW data, with not even white balance applied to it. JPEG/TIFF/converter histograms are of raw data converted to the image vs. RawDigger where you are working with the histogram of the raw data itself. In other words, output histogram vs. input histogram. Subsequently, output images are in “high gamma” (gamma 1.8 for ProPhoto RGB, gamma 2.2 for Simplified sRGB and Adobe RGB spaces), while RawDigger shows the histogram of linear data, that is the gamma of the data is 1.
As a result, the RawDigger histogram looks more “compressed” in shadows and less “populated” in highlights, compared to familiar histograms of the images in “high gamma” working color spaces, unless you switch on the log scale on the vertical axis.
You can also use photographic EV scale for the horizontal axis instead of linear to see how the levels are distributed across the exposure scale.
The Unique Essential Workflow Tool
for Every RAW Shooter
FastRawViewer is a must have; it's all you need for extremely fast and reliable culling, direct presentation, as well as for speeding up of the conversion stage of any amounts of any RAW images of every format.

Now with Grid Mode View, Select/Deselect and Multiple Files operations, Screen Sharpening, Highlight Inspection and more.
5 Comments
ColorCheker
Submitted by Raul (not verified) on
Dear Iliah,
Very interesting. Is that the ColorChecker Passport?
The best to all of you.
Raul
Dear Raul,
Submitted by Iliah Borg on
Dear Raul,
Yes, it is ColorChecker Passport.
--
Best regards,
Iliah Borg
x axis numbers
Submitted by guitarman67 on
Hi Iliah,
I purchased RawDigger recently. I am a little confused by the numbers at the base of the x axis shown above in figure 9. When looking at the raw data for one of my images it shows the MaxG value at around 1589 which I believe means it is a good exposure (with 0% over/under exposed pixels). This info comes from Arthur Morris' guide which I also purchased. However, the numbers shown in Figure 9 only go up to 3400. In the histograms shown in Arthur's examples they go up to 64000, with 16000 being a good value to strive for. Could you please explain these numbers to me as I am quite confused by them. Thank you. Paul
Dear Paul:
Submitted by LibRaw on
Dear Paul:
The figure 9 is for a 12-bit raw.
I'm not sure what camera are you using, and why 16000 is a value to strive for; and also, my guess that you missed one digit in the number, 1589 (unless you are using one of the few non-traditional Panasonic cameras below "base" ISO)
;)
Please, let's continue over e-mail, support@rawdigger.com
query ont...
Submitted by guitarman67 on
Hi Iliah...
Thank you again for the reply. I will email you as requested. Cheers!
Add new comment