
Submitted by lexa on
If one is shooting in raw, they may be interested to see if there is any benefit in using intermediate ISO settings, such ISO 125, 160, etc.
There is, however, no single answer to this question. Why? Because everything depends on how you implement these intermediate ISO settings in the particular camera. Sometimes they are implemented the same way as the main ISO settings, but sometimes they are the result of certain manipulations, such as digital multiplication.
So how can we get to the bottom of this? To demonstrate how this can be determined we will first analyze the so-called Masked Pixels (often called optically black area, or simply OB), which are a portion of the sensor that we normally do not see in our images. It is covered from light, and as such, it can be a good indicator of the lowest possible noise of the sensor, which is very useful because noise is what we analyze to learn how to optimally use a given sensor. (If your camera does not record Masked Pixels in raw file, you can use a black frame instead: set the shortest possible shutter speed, stop the lens down as much as possible, put the lens cap on, close the optical viewfinder if your camera has one, in a word - make sure no light enters the camera).
We are going to take series of shots varying ISO settings from the lowest to the highest using, of course, every intermediate ISO setting available. The subject of the shots doesn’t matter – hell; you can even shoot with the lens cap on.
Next, bring the first shot of the series into RawDigger, and set RawDigger’s preferences to display the black frame (Display Options, Masked Pixels checkbox, checked, Image 1) and to not subtract Black Level (Data Processing, Subtract Black checkbox, unchecked, Image 2).
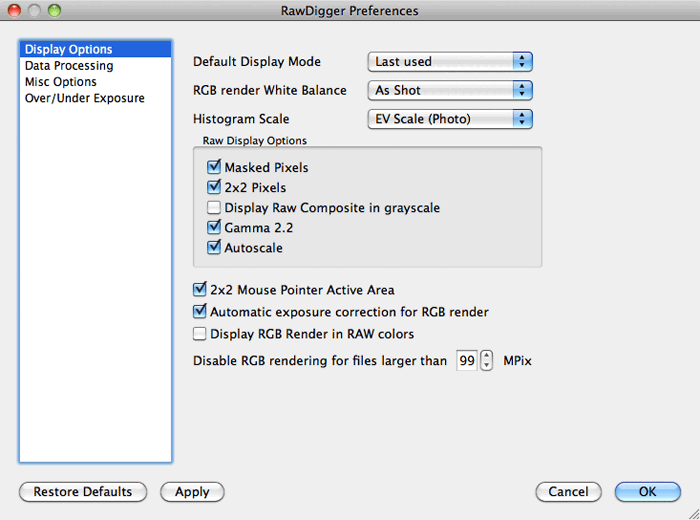
Image 1.
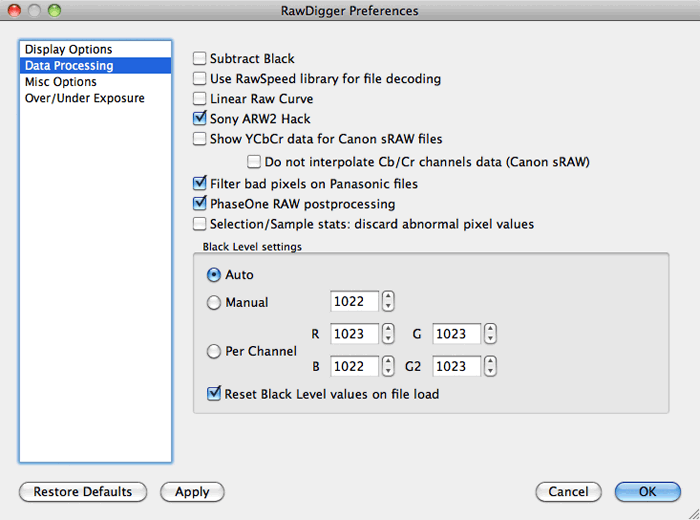
Image 2.
Here we have OB on the left side of the image. Using Selection/Set Selection by Numbers, select the masked pixels, leaving several pixels out of the selection on all four sides they can leak light or have technological imperfections, which can screw up this entire operation).
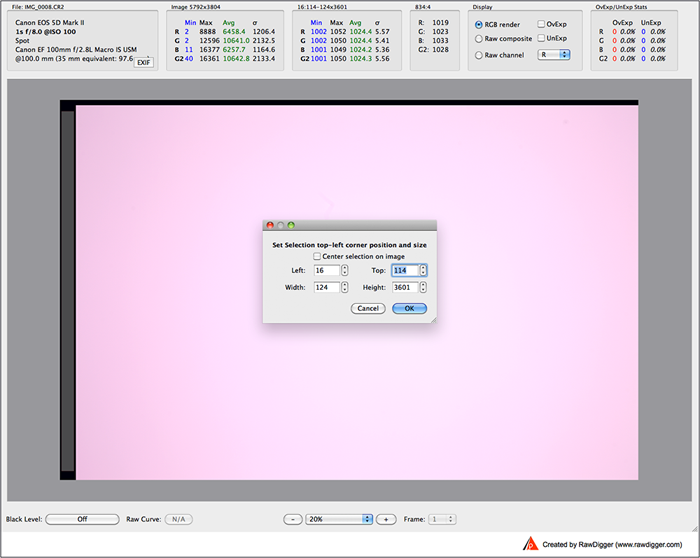
Image 3.
To check that the selection is valid, look at the histogram in Linear Mode. If the histogram closely resembles the bell-shaped curve at all four channels, the selection is valid.
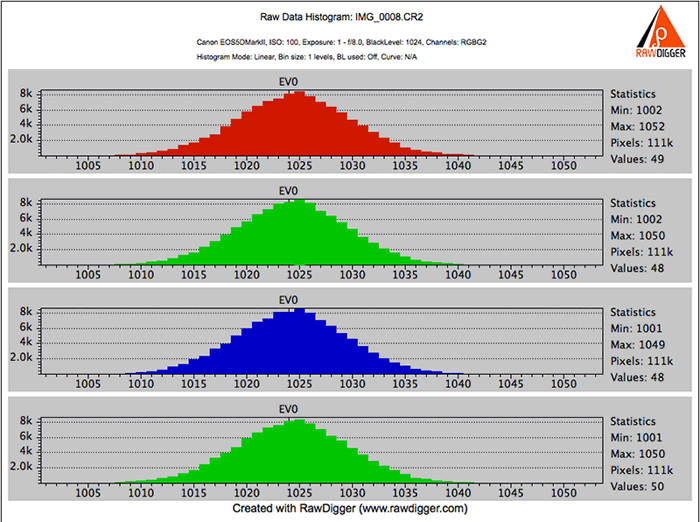
Image 4.
Convert the selection into a sample (Selection/Convert Selection to Sample)…
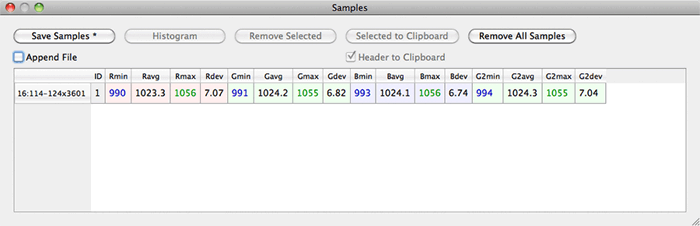
Image 5.
…. and save the data as a .csv file for future processing in a spreadsheet. Please set the checkboxes as per the screenshot below:
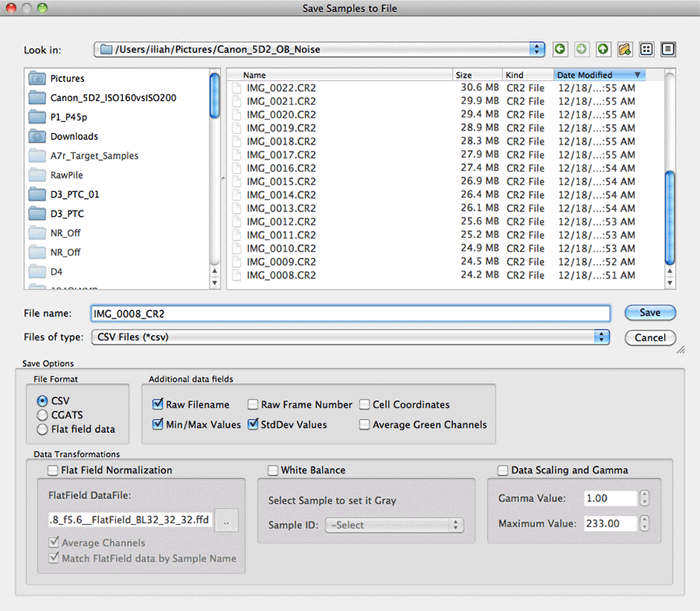
Image 6.
Open the next file and set the checkmark to “Append File”, to append the data to the already existing .csv file. Press “Append File”, and the star mark to the right of the button name should disappear, indicating the data is appended.
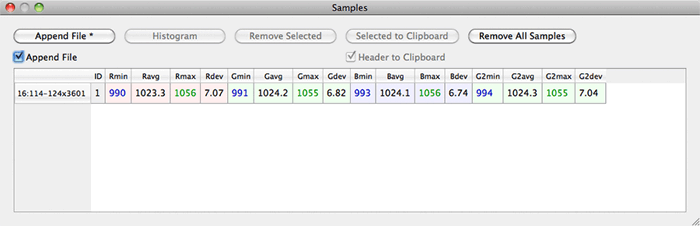
Image 7.
Process the rest of the image series the same way.
Open the .csv file in a spreadsheet, and add an ISO column and fill it with respective values.
Now you can plot the noise against ISO settings; the noise values are in Standard Deviation columns Rdev, Gdev, Bdev, G2dev.
For the Canon 5D2 camera, the plot looks like this:
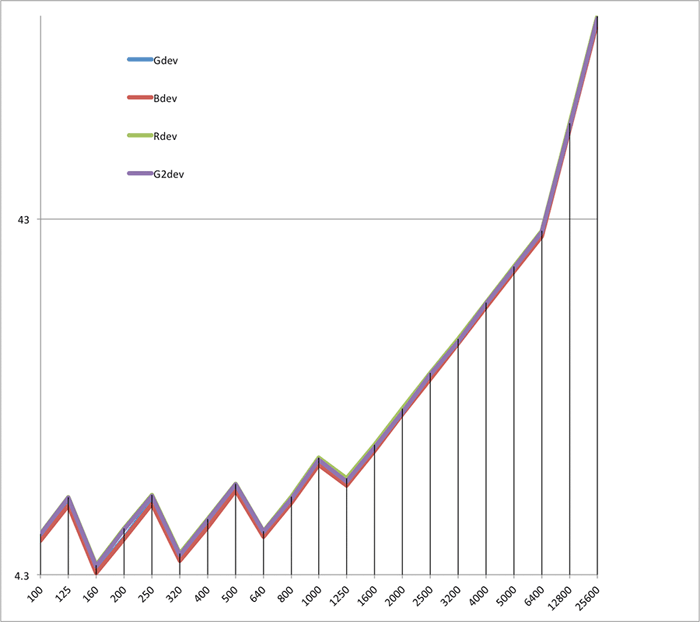
Image 8.
On this plot the X-axis is ISO settings, while the Y-axis is the noise on the logarithmic scale.
You can see that the plots for all four channels are extremely close.
The interesting part is the sawtooth between ISO 100 and ISO 1250. Contrary to expectations, the noise at ISO 160 is lowest while the noise at ISO 125 is higher than at ISO 400. This is enough to suspect that something out of the ordinary is going on. Let’s do some additional calculations.
Dividing Gdev at ISO 125 (6.8361) by Gdev at ISO 100 (5.4293) we can see that the noise is increased by a factor of 1.26 (6.8361/5.4293 = 1.26). Incidentally, 1/3 EV is equal to the cube root of 2 (21/3) = 1.26.
Let’s look at the next slope, formed by ISO 160 – ISO 200 – ISO 250. Dividing the ISO 200 noise value by the noise value at ISO 160, we get a factor of 1.24. Dividing the ISO 250 noise value by the noise value at ISO 200, we get a factor of 1.27. Meanwhile, the noise values for ISO 100 and ISO 200 are very close. This means that we have here some additional stage to form the data values for intermediate ISO settings; they are not “native”. But are they of any use?
From just looking at the noise values, one can deduce that the lowest noise value is at ISO 160. Well, case closed then, right? Just like everyone has been telling us, these intermediate values have the lowest amount of noise, and so are the best for shooting. Whoa, slow down there, you don’t quite have all of the facts yet. Because, you see, it isn’t just the noise value that we are interested in. The characteristic we are looking for is the signal-to-noise ratio. What does this mean? Well, if we take a closer look, it becomes plainly evident that not only is the noise at ISO 160 setting is lower, but the signal is lower as well. In fact, the signal-to-noise ratio for ISO 160 and ISO 200 are essentially the same, especially if we are not just looking at the optically black area but at the image area as well, which is where some light is involved.
Let’s set up a scene which consists of a black trap, essentially reflecting very little light back to the camera, and a small shining metal ball, which will be a source of specular highlights, causing the small portion of the sensor to reach its saturation maximum. There is plenty of advice on the Internet on how to make a black trap; we’re using a Datacolor SpyderCUBE, which is an extremely compact and useful exposure and white balance setting tool.
Place the camera on a tripod and photograph the cube over some matte background at the exact same shutter speed and aperture value, setting ISO 160 for one shot and ISO 200 for another. The shutter speed should be such that it assures a small hot spot on the metal ball.
Testing exposure, bring shots to RawDigger, switch on Overexposure indication OvExp and see that you have one or two small red dots on the ball. On the image below you can see two red “eyes” on the ball. Those eyes indicate sensor saturation.
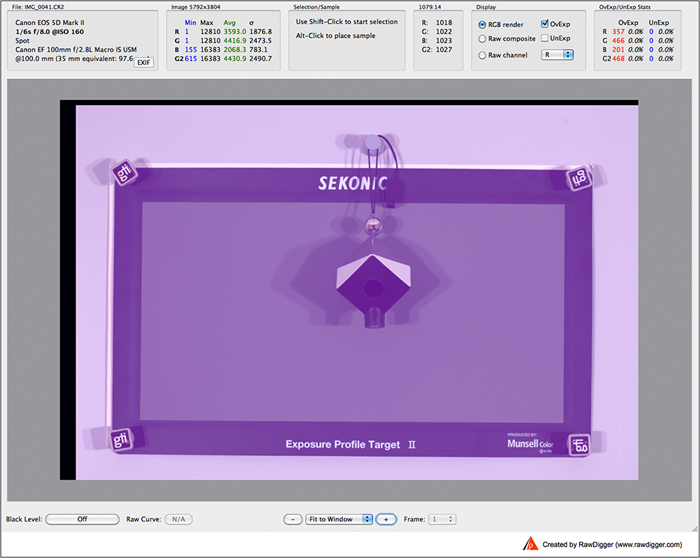
Image 9.
If you do not have them, reshoot with a slower shutter speed, and check if there is now some overexposure on the ball in RawDigger.
Now you should have two shots, one ISO 160 and the other ISO 200, taken with the same shutter speed, which you just determined, and the same aperture value, which we are going to process in RawDigger.
Let’s place two samples on the first shot – one over the black trap and the other over the specular highlight.
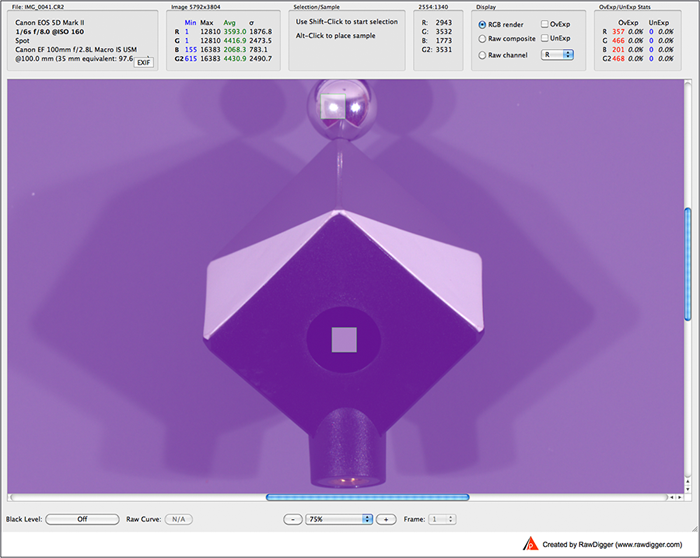
Image 10.
You can change the Sampler Size in RawDigger preferences under “Miscellaneous Options”.
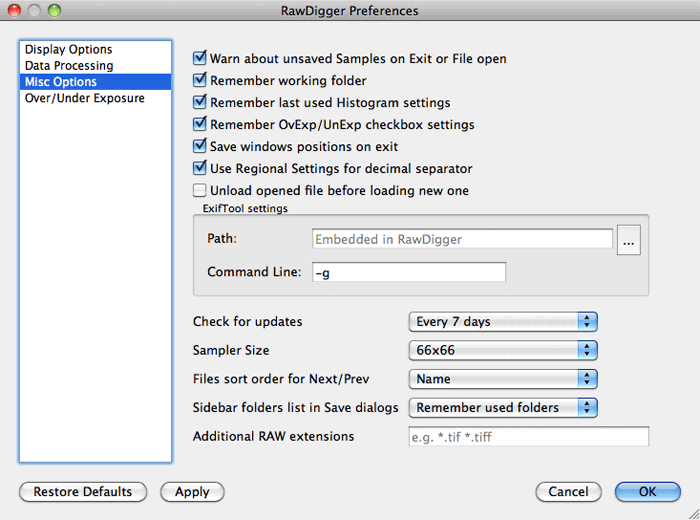
Image 11.
Next, we save the samples to a .csv file
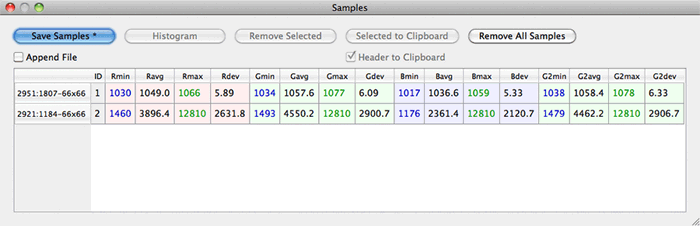
Image 12.
Open the other shot. If there was no mechanical movement between the shots, there should be no need to adjust the sampling position. Changing the mode by checking “Append File” appends the data. Now, let’s go to the spreadsheet.
Open the resulting .csv file in a spreadsheet and calculate the ratio of the saturation level to the noise.
- For the first shot, the saturation is 12810, while the noise is 6.0901. The ratio is 2103.413737.
- For the second shot, the saturation is higher – 15760, and the noise is also higher - 7.334. Nevertheless, the signal-to-noise ratio is slightly better (higher is better), and equal to 2149.071372.
The interesting part here is that the ratio between the saturation at ISO 200 and the saturation at ISO 160 is once again very close to 1/3 EV, that is, 1.23. This is the key to our riddle – for both ISO 200 and ISO 160, the sensor is run in the exact same mode, which is why the signal to noise ratio is practically the same.
The exposure at ISO 160 is in fact the result of exposure at ISO 200 but shifted to the left by 1/3 EV, or in other words, divided by approximately 1.25. Yet another way to put it is that noisewise, the result of an exposure at ISO 160 is equivalent to the exposure at ISO 200 with the shutter speed slowed by 1/3 EV or aperture opened 1/3 EV wider. Of course, it appears from this that the headroom at highlights for ISO 160 is 1/3 EV less compared to ISO 200.
This suggests that though the noise at ISO 160 seems to be lower than the noise at ISO 200, the signal-to-noise ratio is the same and there is no benefit in using ISO 160, at least if you shoot raw.
Now that you know the process, you can repeat this simple analysis for other intermediate ISO settings, looking at the signal-to-noise ratio and decide for yourself whether to use these intermediate ISO settings or not. Mystery solved.
The Unique Essential Workflow Tool
for Every RAW Shooter
FastRawViewer is a must have; it's all you need for extremely fast and reliable culling, direct presentation, as well as for speeding up of the conversion stage of any amounts of any RAW images of every format.

Now with Grid Mode View, Select/Deselect and Multiple Files operations, Screen Sharpening, Highlight Inspection and more.
3 Comments
Fascinating
Submitted by Si Young (not verified) on
Thank you for an interesting article. So effectively, the intermediates are push/pull processed by a 1/3rd of a stop and still presented as raw files.
Would you know how the D4 and other Nikons offer the intermediate raws? Is it the same as the 5DII or a true step without additional raw processing? Many thanks Si.
Dear Sir,
Submitted by Iliah Borg on
Dear Sir,
In Nikon case it is a true analogue amplification step.
--
Best regards,
Iliah Borg
Thank you Iliah.
Submitted by Si Young (not verified) on
Thank you Iliah.
Add new comment