
Submitted by guitarman67 on
Forums:
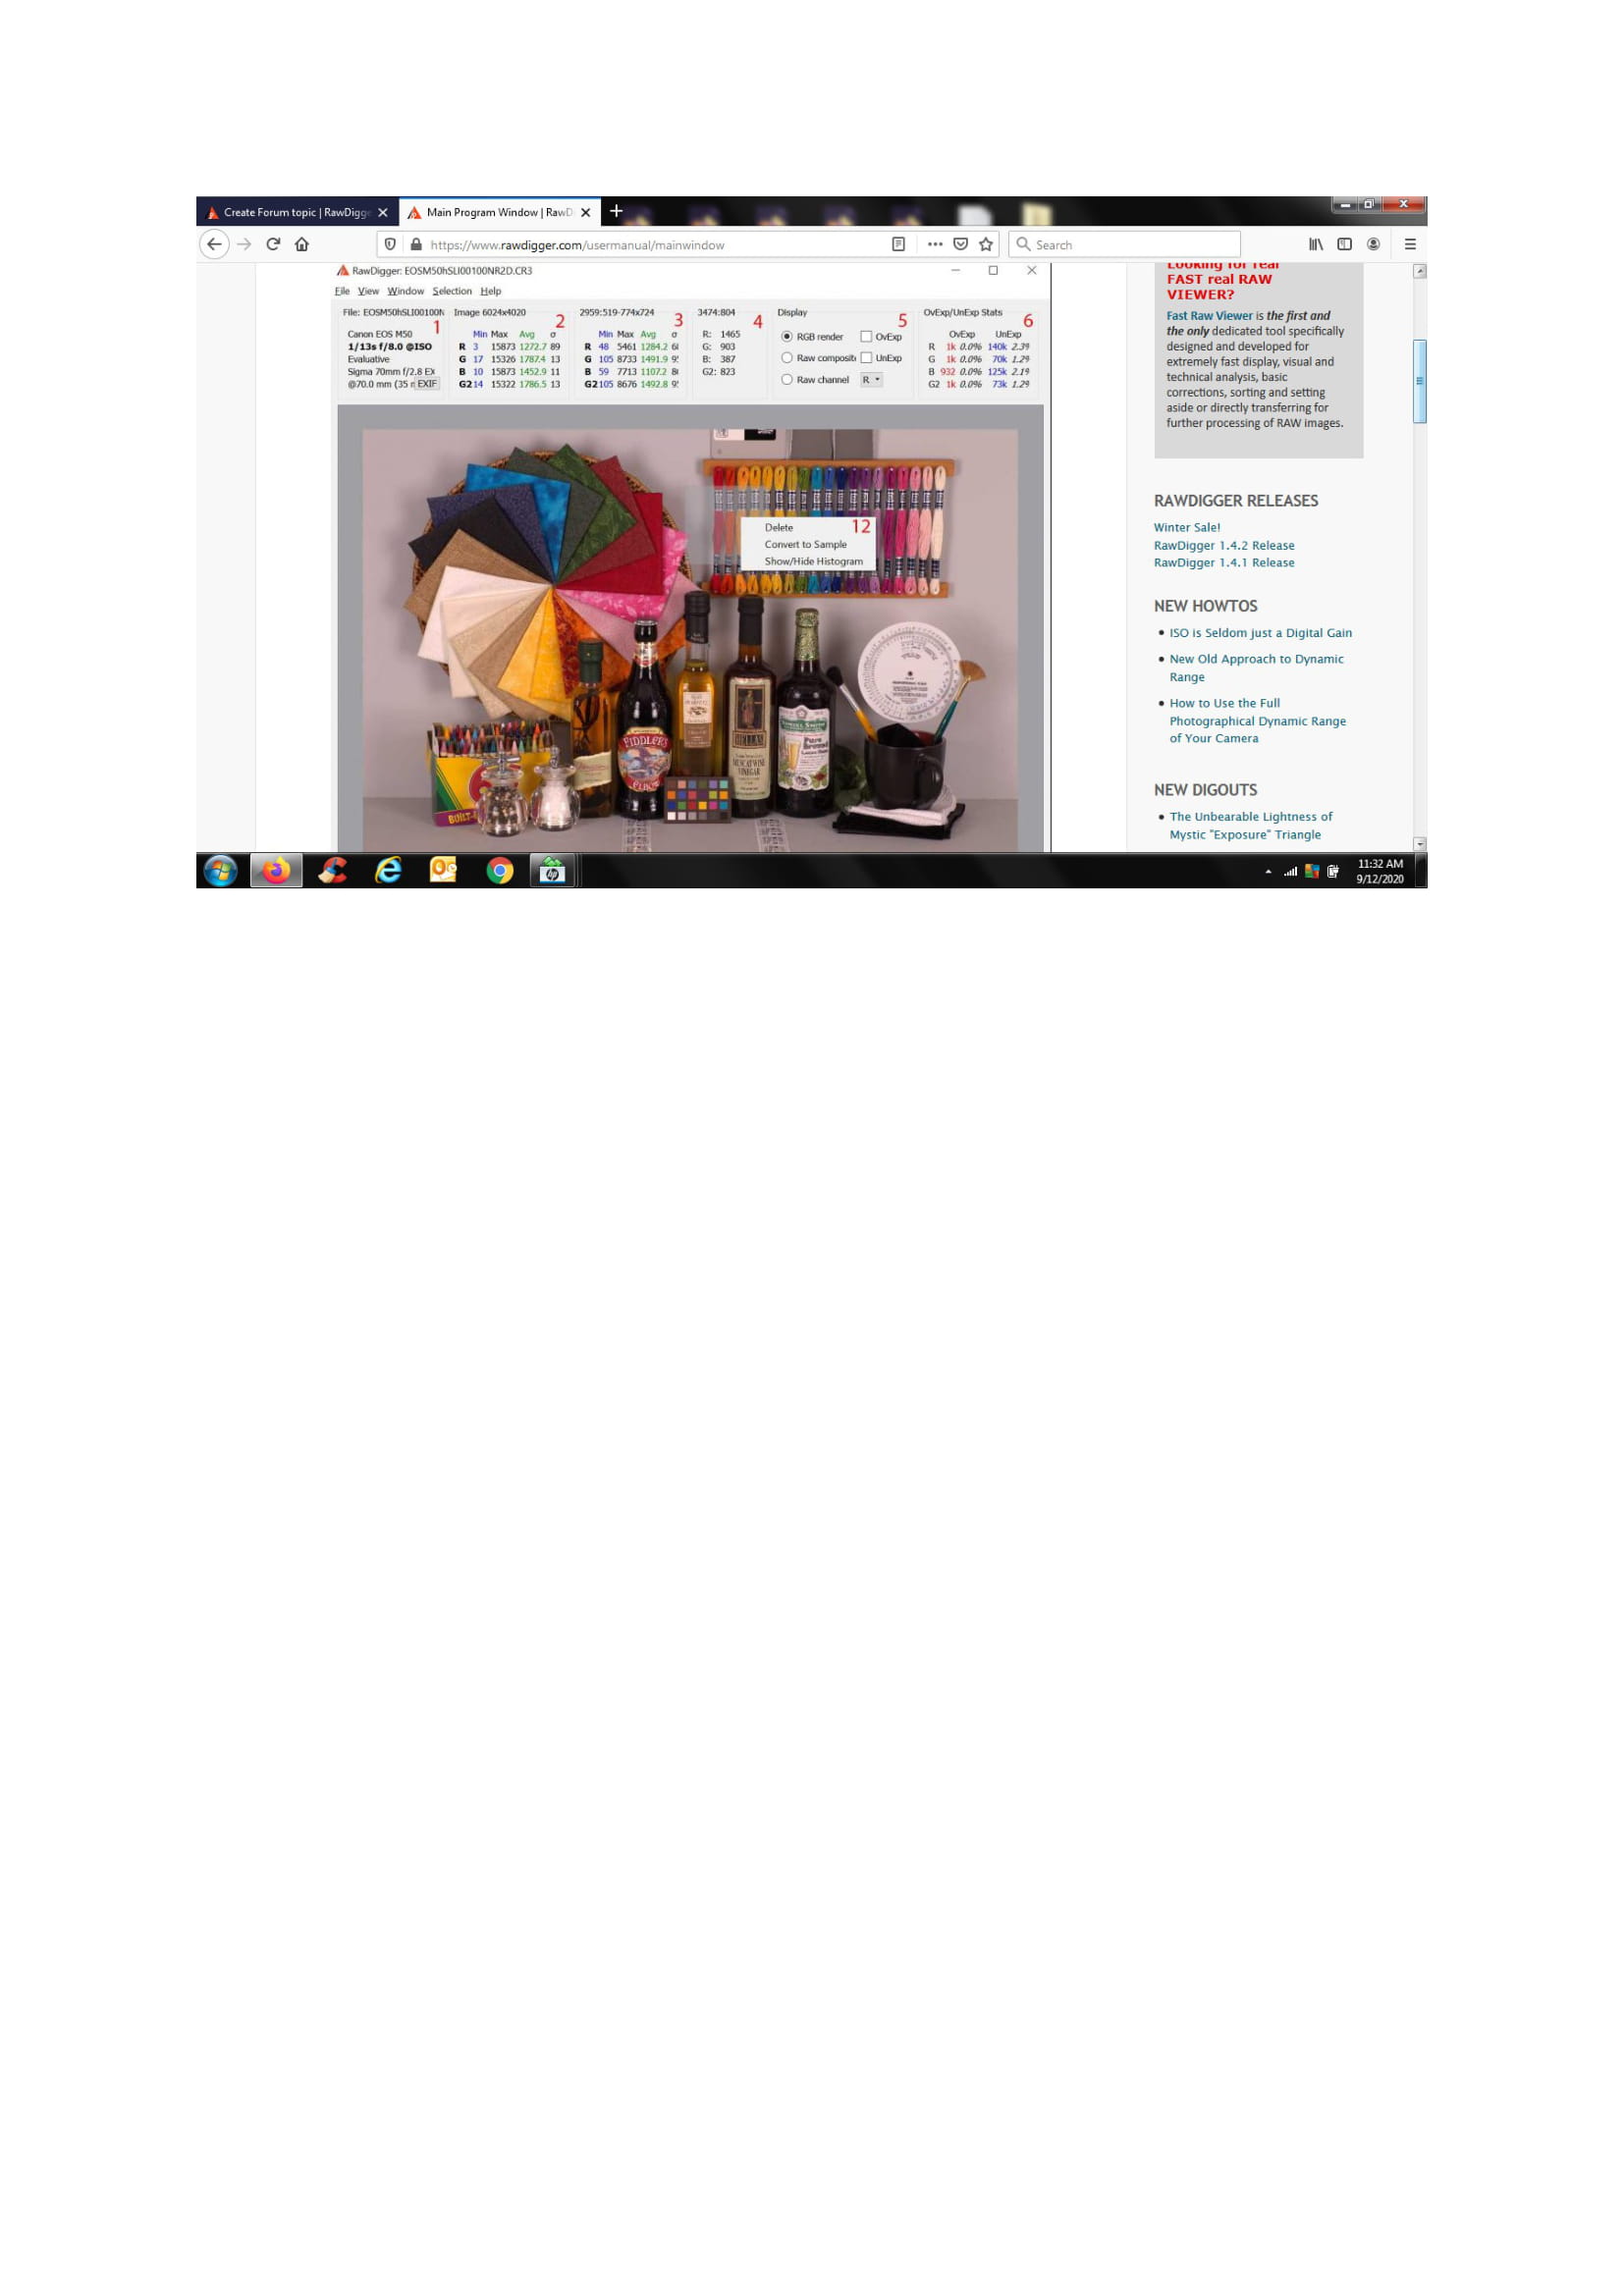
Hi all. This is my first post since buying RawDigger. Could someone please explain to me in very basic language what the numbers mean in the statistics per channel box (see 2) and their relation to the over/under exposed stats (see 6). I'm finding this really confusing. Thanks so much. Paul.
Image:
Dear Sir:
Submitted by LibRaw on
Dear Sir:
Statistics in the box #2: for each color channel, minimum, maximum, average (Avg) and root-mean-square deviation of pixel values (σ) is indicated.
Statistics in the box #6: for each color channel, the number and the percent (relative to the total number of pixels of the given color) of saturated and underexposed pixels is indicated.
Though defaults normally work, one can fine-tune over- and under-exposure detection via Preferences -> Over/Under Exposure tab, please see "Over/Under Exposure tab" section in the manual.
Still confused
Submitted by guitarman67 on
Hello. Thank you for your reply an info. However, your description of the numbers in box2 is the same as in the help file, and means nothing to me. For example: In the Main Program window shown on your website in box 2, it shows 3, 15873, 1272.7, 89 for the red channel. Does this mean that there are a minimum of only 3 pixels in the red channel to a maximum of 15873 pixels. If so, that seems a little inaccurate? The root-mean-square deviation makes no sense to me whatsoever...maybe you could explain this please.
I understand the numbers in box 6, but my question refers to the relationship between the numbers in box 2 and 6. For example, again in the program window shown on your website, the numbers in box 6 show 140K (I assume 140K=140,000 underexposed pixels in the red channel) but the maximum number of pixels in the red channel in box 2 is 15873. How can that be? Hope you can help with these questions.
Thank you,
Paul
Statistics windows (Min/Avg
Submitted by lexa on
Statistics windows (Min/Avg/Max/Sigma) are about pixel values. So '3' is minimal pixel value (on histogram: leftmost non-zero bin), 15873 - maximal value (rightmost bin), 1272.7 - average value (on entire file or in selection), 89 - standard deviation.
Over/Underexposure statistics: pixel count above/below over/underexposure threshold (in histogram terms: total height of bins on the right of threshold for OE, on the left on threshold for UE)
query continued
Submitted by guitarman67 on
Thanks again, but sorry I'm still confused...this is very technical to me. You say 3 is minimal pixel...leftmost non-zero bin. This means nothing to me...please explain in very simple terms. What does minimal pixel value mean? Is this the size of a pixel?
What does the "K" represent in the over/underexposure refer to? K=1000?? So does 140K mean 140,000 pixels? (I did refer to this in my previous post)
Thanks again.
yes, k for 'kilo', 'm' for
Submitted by lexa on
yes, k for 'kilo', 'm' for million.
There is a good (enough) image histogram explanation in Wikipedia: https://en.wikipedia.org/wiki/Image_histogram
I definitely can't write better
query continued
Submitted by guitarman67 on
Thanks again for the info. It's still somewhat confusing, but I'll stick with it. By the way K=1000 is better than saying K=kilo (kilo is weight). Other people may also find the technical stuff difficult too?
kilo is common/well
Submitted by lexa on
kilo is common/well recognized prefix for 1000: kilo-gramm, kilo-meter, kilo-watt, etc, etc,etc. Same for m (mega = million)
Sigma
Submitted by Tony (not verified) on
For clarity: Sigma is the 'Standard Deviation' and it's calculated as a root mean square. It is a standard statistical measure so a sensible figure to provide. A non-technical description is that it measures spread. An average gives an indication of a middle value, the Standard Deviation (SD) tells you whether most of the values are close to the mean (small value) or whether they are spread out (large value).
Think about a Tube train at rush hour: the average number of passengers will be its capacity and the SD will be small because it's always packed full (there's little variability). Off-peak, the average will be much less than the capacity. The actual numbers will be quite variable because sometimes the train is empty and sometimes it carries quite a lot of people: the SD will be bigger and is telling you about that variability.
Hi Tony,
Submitted by guitarman67 on
Hi Tony,
Many thanks for your reply and the info. Things are getting clearer all the time and your analogy has helped. Thanks again
Paul
Add new comment