
Submitted by lexa on
The Window->Histogram menu item shows the window with per channel histograms plotted using all the file data.
RawDigger histograms have the following features:
- The Horizontal scale can be either linear (according to values in raw data from the currently opened file) or photographic (linear with respect to the EV scale, that is, every next step of the scale contains twice the signal compared to the previous one). The horizontal axis has two sets of tick labels: linear under the histogram and photographic above the histogram.
- The Vertical scale can be either linear or logarithmic.
- The width of the histogram columns (bins) is always equal to an integer number of pixels in order to reduce aliasing (moir ). Hence, if the column (bin) width is chosen automatically, the histogram occupies from to all of the window width and cannot zoomed by an arbitrary factor.
- All per channel histograms are displayed using the same scale.
The histogram window contains histogram controls, which are shown on the next figure.
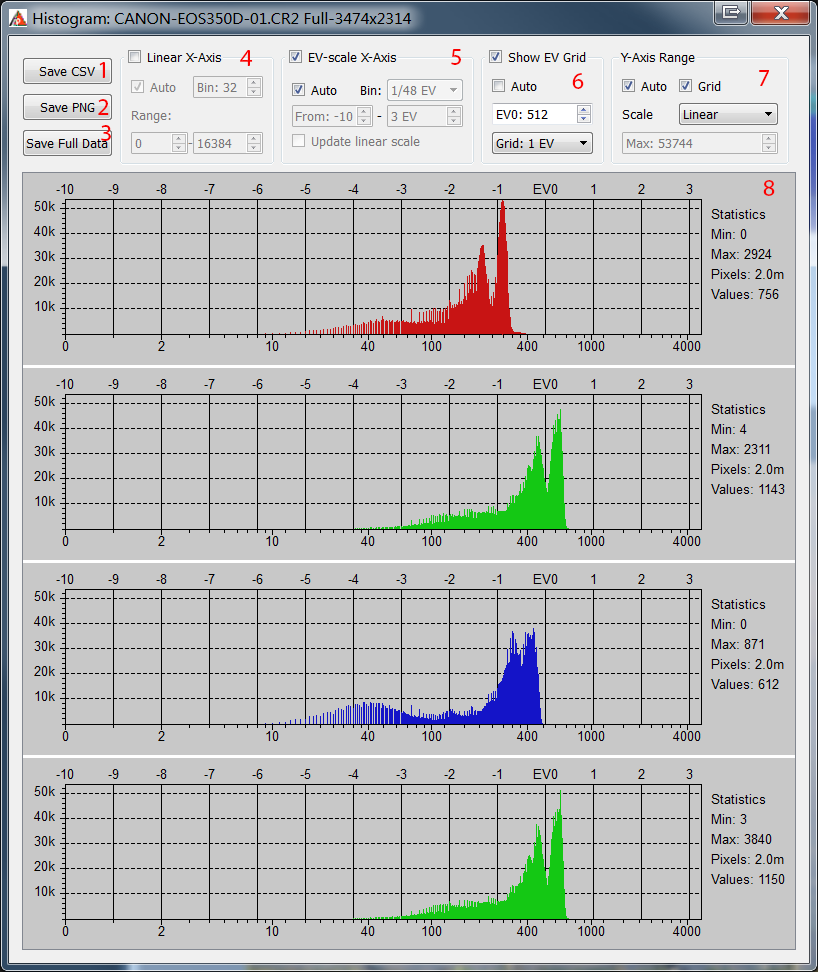
- Save CSV: saves the histogram in the form of a CSV file suitable for further processing (e.g., in Microsoft Excel). The data in the histogram bins is saved according to the current preferences (bin width, work mode, etc.; see below).
- Save PNG: saves the histogram in the form of a graphic file (PNG or JPEG; to save it in JPEG, one should select the extension .jpg or .jpeg for the file to be saved).
- Save Full Data: saves the unprocessed histogram data (not sorted into bins); data is saved as the signal level value vs. the number of pixels with this value.
- Histogram representation in linear mode
In the linear mode, the horizontal scale is constant all along the horizontal axis. In this mode, the major portion of the plot is occupied by highlights (and, to a lesser extent, midtones) of the image, whereas the shadows occupy a narrow range near the left border of the histogram.
Linear mode controls:- Linear X-axis: linear mode on.
- Auto: automatic choice of minimum/maximum and histogram bin width according to horizontal axis.
- Bin Size: manual setting of bin width (number of levels in one bin is set).
- Range: setting of the visible range on the horizontal axis.
- Histogram representation in photographic mode
In the photographic mode, the horizontal scale is linear with respect to the exposure stops (exposure value units, EV). Each stop, regardless of its position in the tonal range of the photo (shadows, midtones, highlights), occupies the same length along the horizontal axis of the histogram.
In the shadows, the number of possible levels may be smaller than the one set by the histogram bin size. For example, the 3rd photographic step from black level of the image corresponds to values from 4 to 7 inclusively, meaning that there are 4 different levels. In this case, some of the bins will have a height of zero and there will be holes in the histogram.
Photographic mode controls:- EV-scale X-Axis: photographic mode on.
- Auto: automatic choice of bin width and visible histogram range.
- Bin size: manual setting of bin width, as a fragment of 1EV (photographic stop).
- Range: setting of the visible range on the horizontal axis.
- Update Linear Scale: if on, modifications of photographic mode range will also change the linear range.
- Viewing EV grid
The EV grid (photographic stops) is shown in the form of solid vertical lines in the histogram field.
Controls:- Show EV Grid: show/hide EV grid.
- Auto: automatic calculation of grid zero (gray point position) and setting grid step to 1EV. The zero is located at the level that is 3 stops (8 times) lower than the maximum pixel value rounded up (ceiling) to the nearest power of 2. For example, if the maximum value of all pixels in the photo is 3000, then the nearest power of two greater than this value is 4096 and the EV0 value for this photo will be automatically set to level 512.
The maximum can be determined either as the maximum pixel value in the currently opened frame, or as a theoretical maximum for the given camera. The setting that switches on the choice of the theoretical maximum for the maximum is available in Preferences – Histograms – Set histogram EV0 by (please see the chapter on Preferences below). - 0 EV at: setting the level for EV0. In photographic mode of the histogram display, changes in EV0 also affect the data visualized; hence, the look of the histogram changes.
- EV tick: setting the EV grid step (1/3EV,1/2EV, 1EV, 2EV).
- Vertical scale control
Vertical scale display is controlled using the folowing elements:- Auto the upper limit is determined automatically so that all the counts fit into the histogram window while the lower limit is always set to zero
- Scale – controls the scaling of the vertical axis:
- Linear – the scale of the vertical axis is linear (default).
- Logarithm – the vertical scale is set to logarithmic; the graph is calculated for log(count+1) to prevent log(0) issue.
- Square root – the height of the bars is proportional to the square root from the number of pixels that correspond to the bin.
- Grid display the horizontal grid lines.
- Max - set the maximum value for vertical axis, available only with Auto off.
- Statistical data for the histogram:
- Min/Max minimum and maximum values for the pixels in the given channel (color)
- Pixels for the area which is used for the histogram, number of pixels in the given channel.
- Values number of different pixel values in the given channel.
Last comments